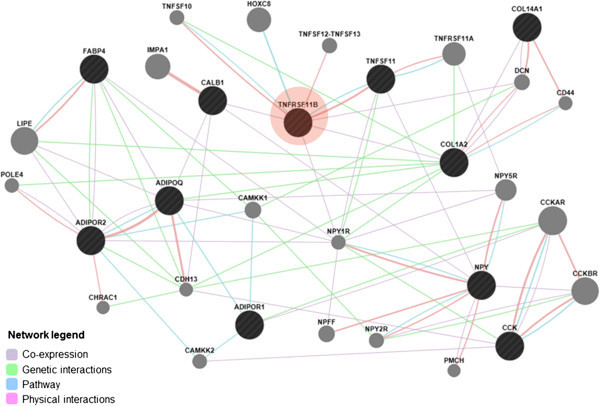
Figure 1.

OPG ( TNFRSF11B ; in red) gene network. Circles represent genes and connecting lines represent interactions between genes. Black circles represent the set of genes provided to the GeneMania software. Gray circles are the extra genes added to the network by the program that are strongly connected to query genes.
