
Figure 6.
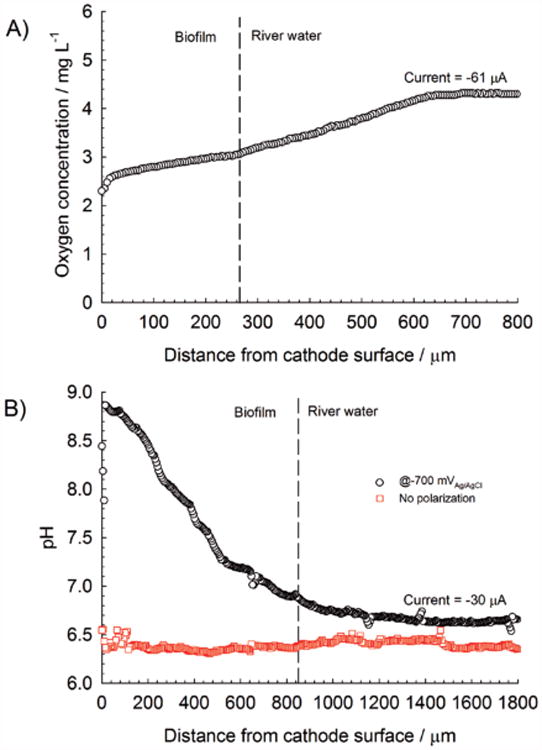
A) Oxygen depth profile of a cathode after 19 d of continuous polarization at −700 mVAg/AgCl; B) pH depth profile of the same polarized cathode after 25 d. For comparison, a pH depth profile of an initially unpolarized cathode is shown. Dashed lines represent the approximate biofilm/river-water interface.