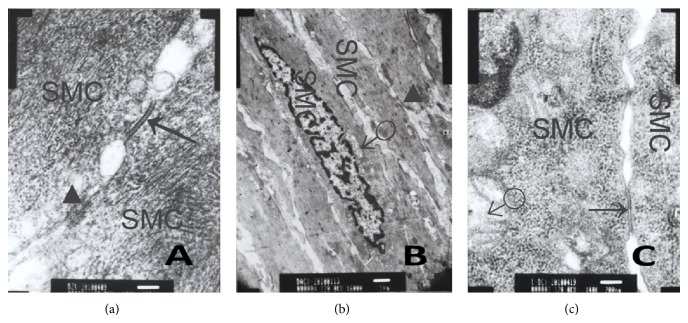
Figure 13.
Cx43 between SMC and SMC using transmission electron microscopy. (a) Control group shows gap junction (↑) between SMC and SMC. Desmosomes junction (▲) between SMC and SMC. The distance was about 25–30 nm. There was also middle dense band or middle line in desmosomes junction and dense spot about 10 mm thick on the inside of plasma membrane (ruler: 100 nm); (b) MODS group shows no gap junction between SMC and SMC, and chromatin condensation and aggregation could be seen in SMC. Some mitochondria (♂) were swelling. There was desmosomes junction (▲) between SMC and SMC, dense spots of one desmosomes junction were asymmetric, and no middle line (ruler: 1 μm); (c) DCQD group, gap junction (↑) with intact structure between SMC and SMC. There were many mitochondria (♂), and though some were swelling, there was no ruptured mitochondria. Moreover, cell membrane was clear (ruler: 1 μm).

