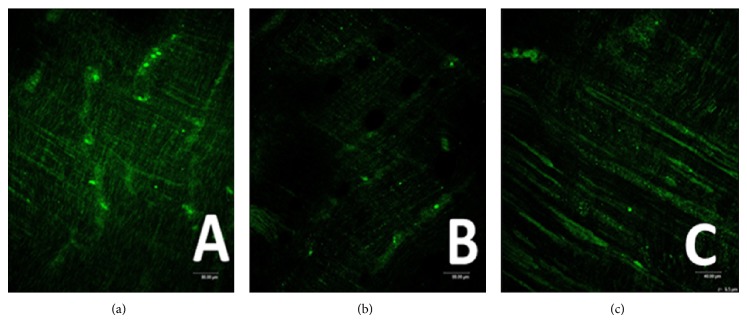
Figure 2.
ICC-DMP using confocal microscopy. (a) Control group shows ICC-DMP connected to each other and formed network (Ruler: 80 μm); (b) MODS group shows there was an obvious decrease in numbers of ICC and synapses. Moreover, network integrity was damaged. IOD was also markedly decreased (ruler: 80 μm); (c) DCQD group shows ICC and synapses of ICC were more than MODS group, maintaining net structure (ruler: 40 μm).

