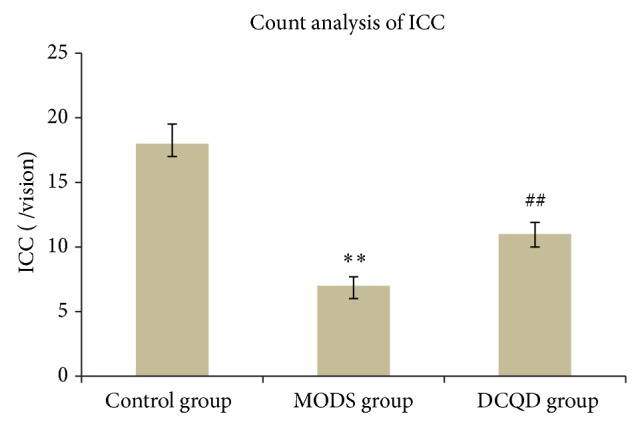
Figure 3.

Count analysis of ICC. Three specimens in each group and three high magnification visions in each specimen were observed randomly. Compared with control group, n = 9, ** t = 8.295, P < 0.01; compared with MODS group, n = 9, ## t = 4.041, P < 0.01.
