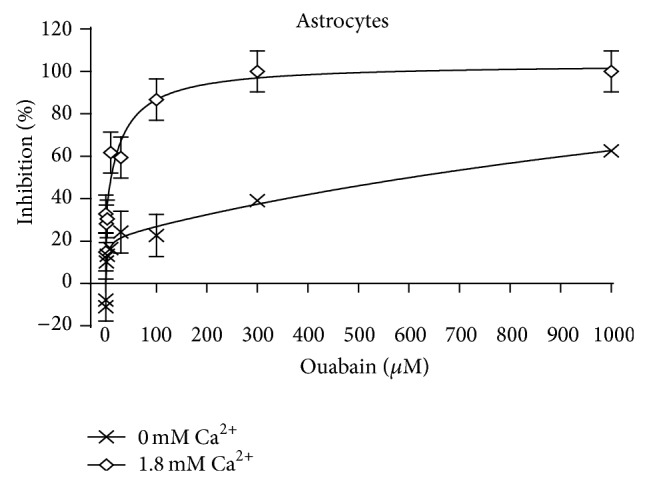
Figure 3.

Ouabain induced inhibition of net influx of 42K into primary cultures of mouse astrocytes. The uptake was determined during a 1.00 min incubation, which provides initial uptake rates. The graph marked by diamonds was obtained in a slightly modified Dulbecco's medium containing 1.8 mM Ca2+ (for further details see Section 2) and that marked by X in a corresponding medium containing no CaCl2. The inhibition was calculated from the ratios between uptake rates in the absence of ouabain and that at the ouabain concentration in question. The calculated inhibitions were analyzed as a function of the ouabain concentration by GraphPad Prism 6, assuming that they are biphasic, which gave the best fit. SEM values for inhibition of cultures incubated at 1.8 mM Ca2+ were obtained from the standard errors given in the Graph Pad analysis for, respectively, high and low affinity. For cultures incubated without Ca2+ SEM value for the lower concentrations (high affinity) were similarly based on the Graph Pad analysis. A similar procedure could not be used for the low-affinity component, since the total inhibition did not approach 100%, and the computed standard error accordingly was excessively high. Therefore no SEM values are shown for the two highest concentrations, but they must resemble those at the lower concentrations, since the original uptake readings had approximately similar uncertainties at all concentrations. The apparent stimulation at low ouabain concentrations in the absence of Ca2+ reflects an ouabain-mediated stimulation of uptake, normally occurring at low nanomolar concentrations [17]. In both graphs 6 cultures from 2-3 different batches had been used for each point.
