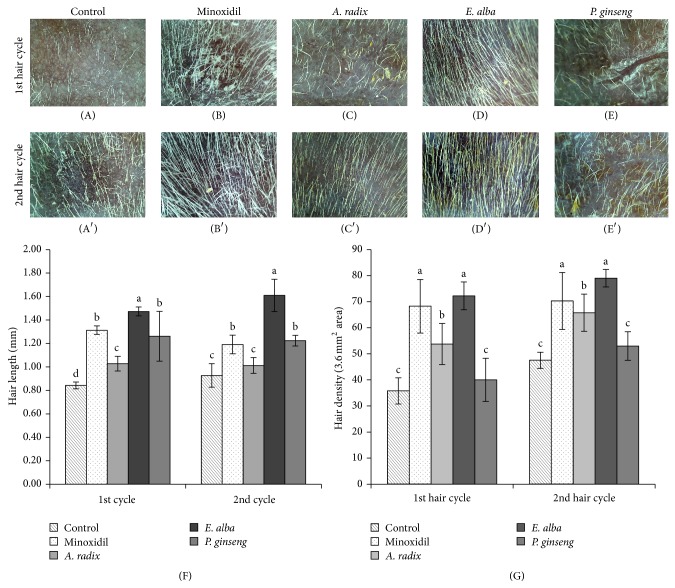
Figure 3.
Evaluation of hair length and hair density in cycles. Image of nude mice hair on skin surface, treated with control ((A), (A′)), minoxidil ((B), (B′)), A. radix ((C), (C′)), E. alba ((D), (D′)), and P. ginseng ((E), (E′)) in first and second hair cycles. Hair length (F) and hair density (G) shown in column. The different letters (a, b, c, and d) within a column indicate significant differences (P < 0.0001) determined by Duncan's multiple range test. Digital images were takenby KONG, Bom-Viewer Plus with 80× magnification lens. Hair length and hair density were measured using Bom-Viewer Image analyzer (n = 10).

