
Figure 3.
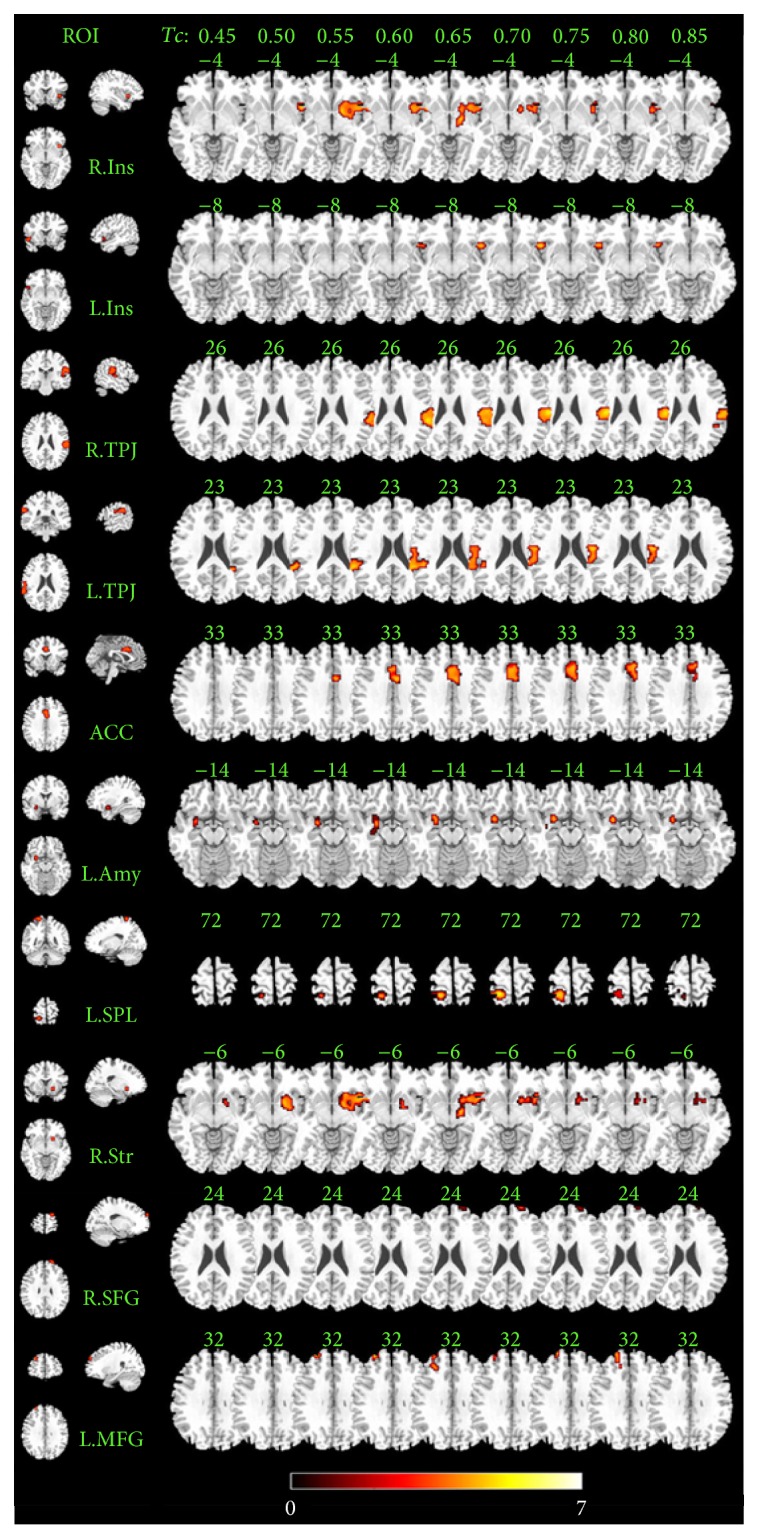
Significantly increased local FCD in musicians compared with nonmusicians. The left column shows 10 ROIs' position. The right part shows significantly increased local FCD in 10 axis images and 9 Tc values separately. ROIs' abbreviations are consistent with those shown in Table 1.