
Figure 2.
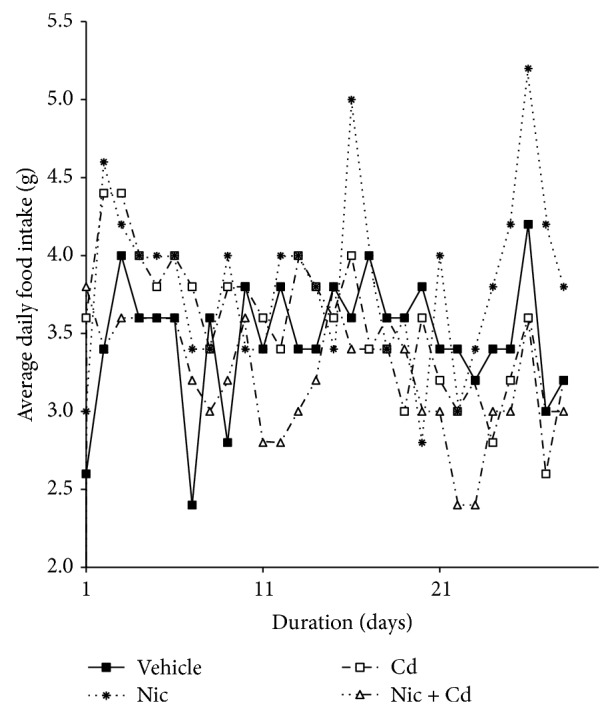
Average daily food intake (P28 to P56) in female adolescent mice. Similar to the observations in weight changes, the average daily food intake increased in the nicotine and cadmium treated groups when compared with the control. Consequent of nicotine-cadmium treatment, a decline in food intake was observed around P46 versus the saline treated mice. This precedes the weight loss in this group (P50) as shown in Figure 1. Each point represents daily recorded food intake/group expressed as mean ± SEM.