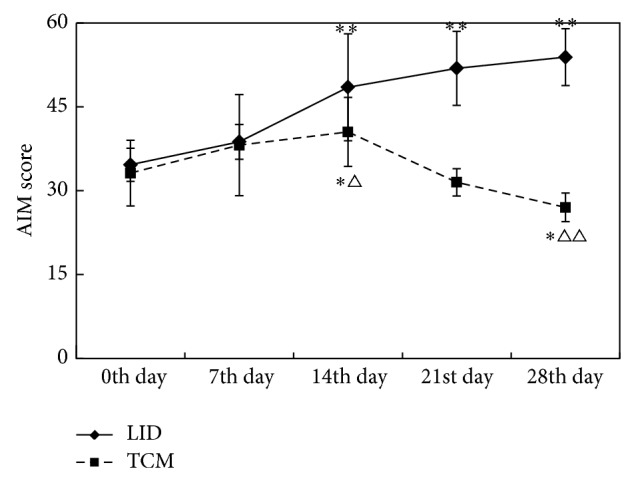
Figure 3.

Comparison of AIM score before and after dosing between different groups. (AIM score * P < 0.05, ** P < 0.01 compared with 0th day; AIM score △ P < 0.05, △△ P < 0.01 compared with LID group.)

Comparison of AIM score before and after dosing between different groups. (AIM score * P < 0.05, ** P < 0.01 compared with 0th day; AIM score △ P < 0.05, △△ P < 0.01 compared with LID group.)