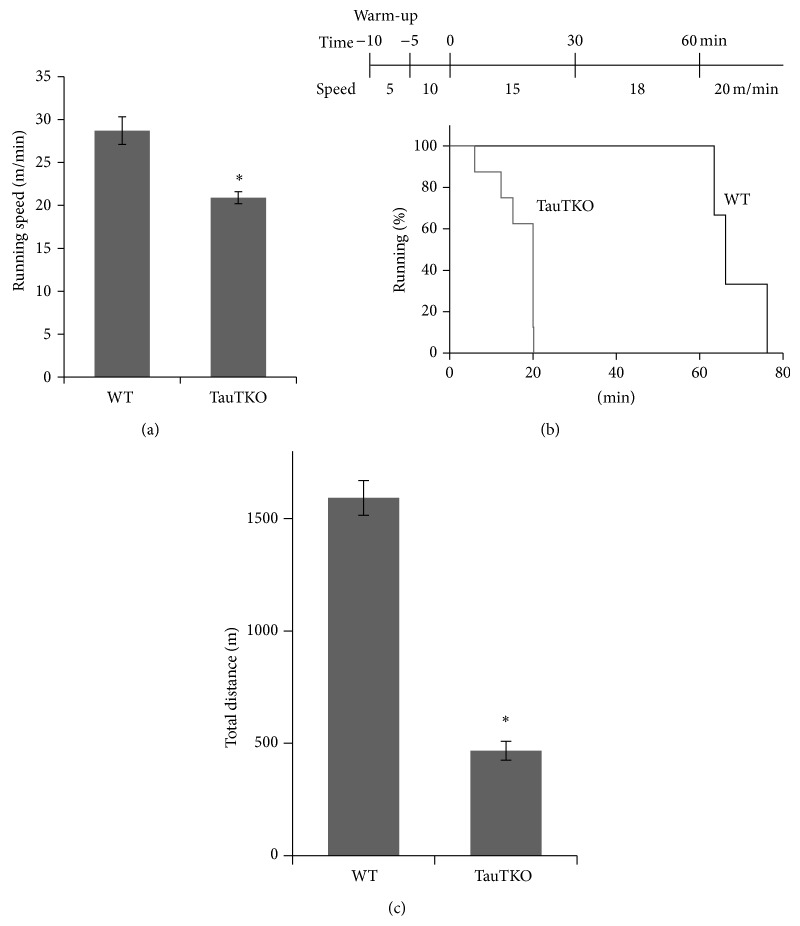
Figure 1.
Running speed and running duration in TauTKO and WT mice. (a) Mean running speed of TauTKO (n = 8) and WT mice (n = 6). (b) Running endurance of WT and TauTKO mice (TauTKO: n = 8, WT: n = 3). This graph shows the survival plot indicating the percent of WT and TauTKO mice running at the indicated time during treadmill running test (15–20 m/min, 0% gradient). Lines mean percent of WT mice (black) and TauTKO mice (gray). Total run distance was calculated in (c).

