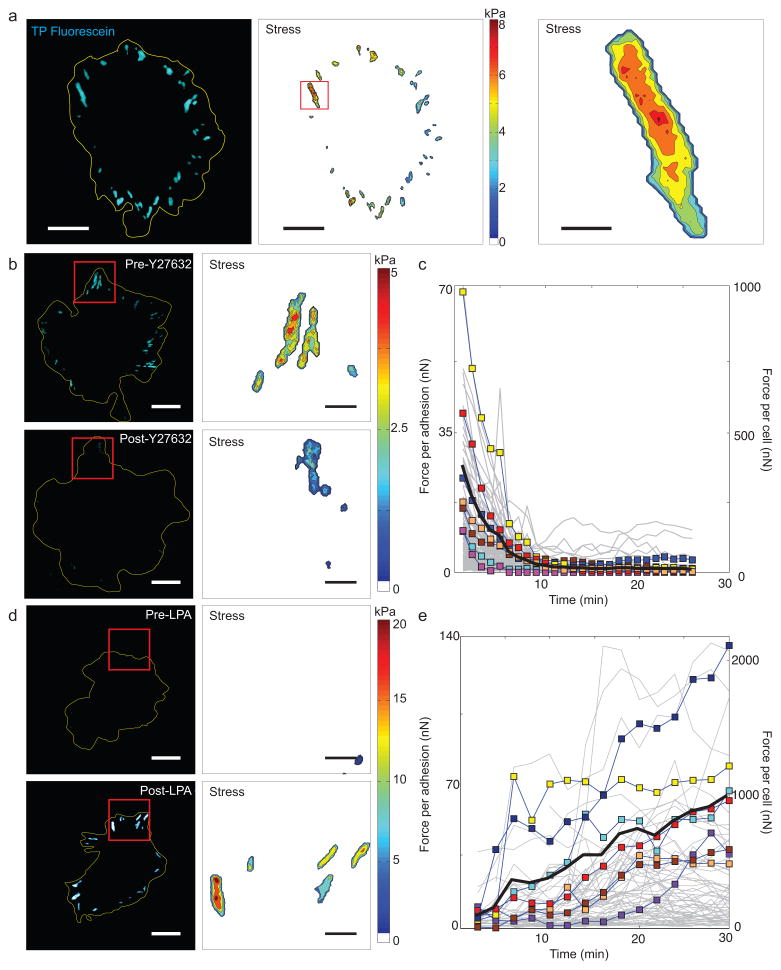
Figure 2. Fluorescence reports cellular traction forces.
(a) Image of MEF attached on TP-coated substrate. Fluorescent signal from TPs beneath a spread cell (yellow outline) were acquired (left panel), then converted to traction maps calculated from the fluorescence level (middle). The maps show distributions of forces across the cell consistent with the size, shape, and location of FAs. Examination of individual adhesion sites (right) shows a heterogeneous distribution of stress within each site (scale bars: 20 μm, left two panels; 3 μm, right panel. (b,d) Fluorescence (left) and traction map (right) reported by TPs of cells spread before (top panels) and after (bottom) addition of either the ROCK inhibitor Y27632 (15 min after treatment) (panel B) or LPA (1 hr after treatment), an activator of Rho (panel D) (scale bars: 20 μm; left; 5 μm, right. (c,e) Plots of mean stress per adhesion site as a function of time for individual cells treated with Y27632 (panel c) or LPA (panel e). Individual adhesions (grey lines); individual cells (colored squares and lines); mean of all cells (black solid line). n ≥ 7 cells and 650 adhesions. TP calibrations were carried out using the values for 37°C found in Supplementary Table 1.

