Figure 6.
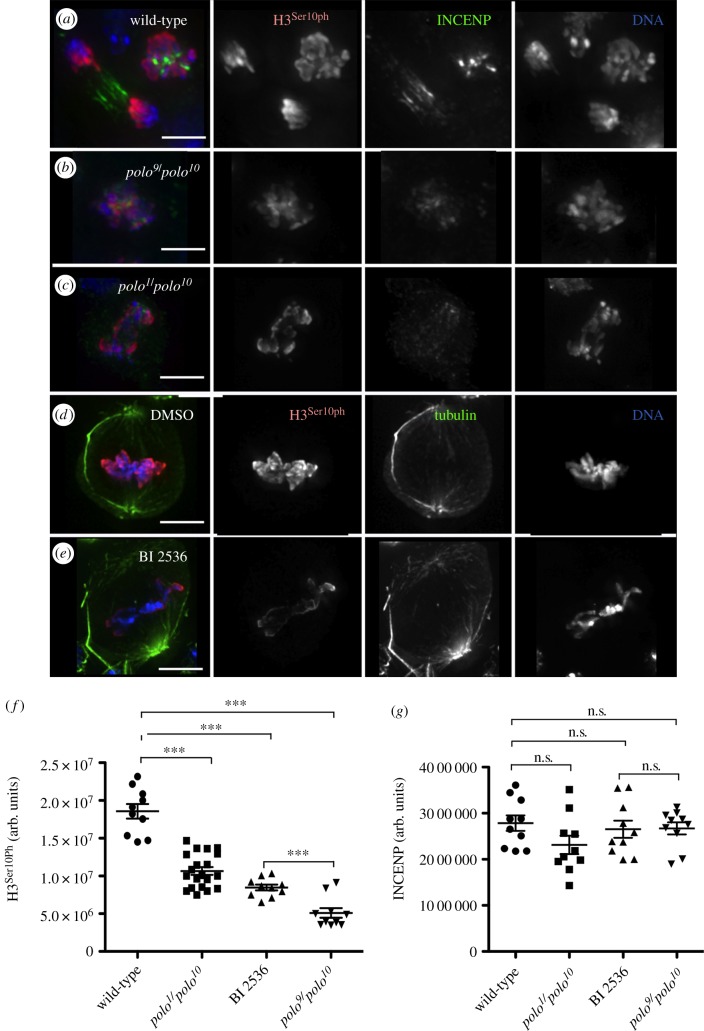
Aurora B activity is reduced in polo mutant and BI 2536-treated neuroblast mitoses. (a–c) Levels of phosphorylation of Histone3-Ser10 in neuroblast mitoses. (a) wild-type, (b) polo9/polo10mutants, (c) polo1/polo10 mutants. Green, INCENP; red, PhosphoHistone3-Ser10; blue, DNA. (d–e) Levels of phosphorylation of Histone3-Ser10 in DMSO (d) and BI 2536-treated (e) neuroblasts. Green, tubulin; red, PhosphoHistone3 Ser10; blue, DNA; scale bars, 5 µm. (f–g) Quantification of the levels of Histone 3-Ser10 phosphorylation (f) and INCENP (g) in polo mutant combinations and BI 2536-treated neuroblasts. In (f), t-test comparing wild-type with each of three experiments shows differences are significant (***p < 0.0001); difference between BI 2536-treated and polo9/polo10 is also significant (***p < 0.0003).

