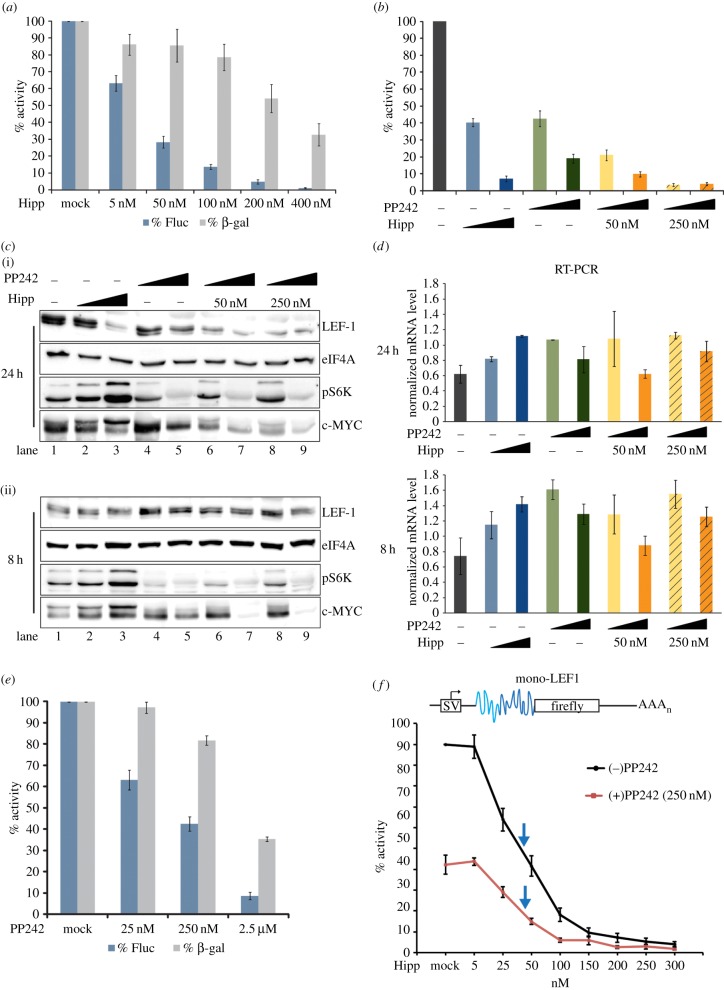
Figure 3.
(a–f) LEF-1 protein translation is sensitive to the inhibitory actions of hippuristanol and PP242. (a) pSTF-LEF1 and β-gal control vector were transfected into K562 cells. Cells were treated with titrating concentrations of hippuristanol (Hipp) for 24 h. Activity is represented as a percentage of the mock-treated cells. (b) K562 cells transfected with pSTF-LEF1 and β-gal control vector were treated with DMSO (dark grey), 50 nM (blue) or 250 nM (dark blue) hippuristanol, 250 nM (green) or 2.5 µM (dark green) PP242, or both drugs at alternating low and high concentrations (orange, dark orange). Cells were harvested at 24 h post-treatment for luciferase assays. IRES activity is represented as a percentage of the activity in mock-treated cells. (c) K562 cells were treated with hippuristanol, PP242 or both drugs (same concentration as (b)) and harvested at 24 h (i) or 8 h (ii) post-treatment for western blot. (d) In parallel with protein analysis in (c), semi-quantitative RT-PCR was performed to probe for LEF1 mRNA (Pr2 primers). (e) pSTF-LEF1 and β-gal control vector were transfected into K562 cells and treated with titrating concentrations of PP242 for 24 h. Fluc and β-gal activity are represented as a percentage of the activity in mock-treated cells. (f) Mono-LEF1 (top schematic) and β-gal control vector were transfected into K562 cells. Cells were treated with titrating concentrations of hippuristanol in the absence (black line) and presence (red line) of 250 nM PP242 for 24 h. IRES activity is presented as a percentage of mock-treated cells. Blue arrows indicate the IC50 for each set of drug treatments.

