Fig. 1.
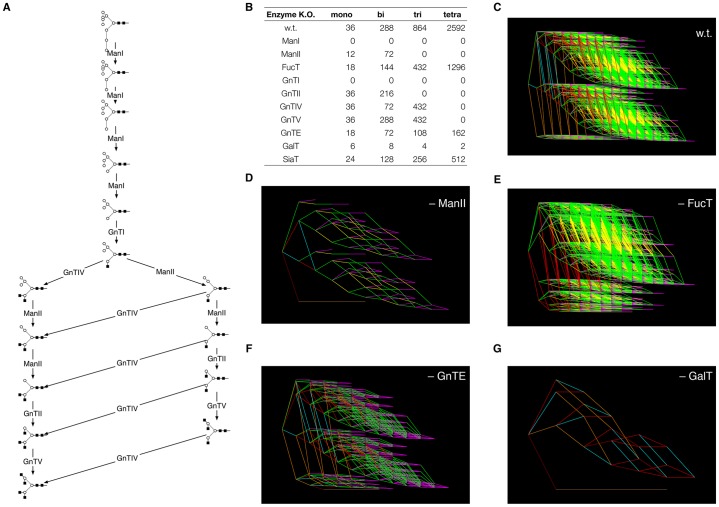
In silico knockouts of enzymes of N-glycosylation and their effects upon reaction network complexity. (A) Core network of glycosylation, showing the initial stages of N-glycosylation starting with Man9 (M9) and further catalysed by the enzymes described in Table 1. For symbol key, see Fig. 4 inset. (B) Total numbers of mono-, bi-, tri- and tetra-antennary N-glycan structures predicted by the model for wild-type (w.t.) and individual enzyme knockouts. (C–G) Reaction network diagrams corresponding to five of the knockouts shown in B. Colour key: GnTs I, II, IV and V, red; GnTE, yellow; GalT, green; ManI, brown; ManII, orange; FucT, cyan; SiaT, magenta.

