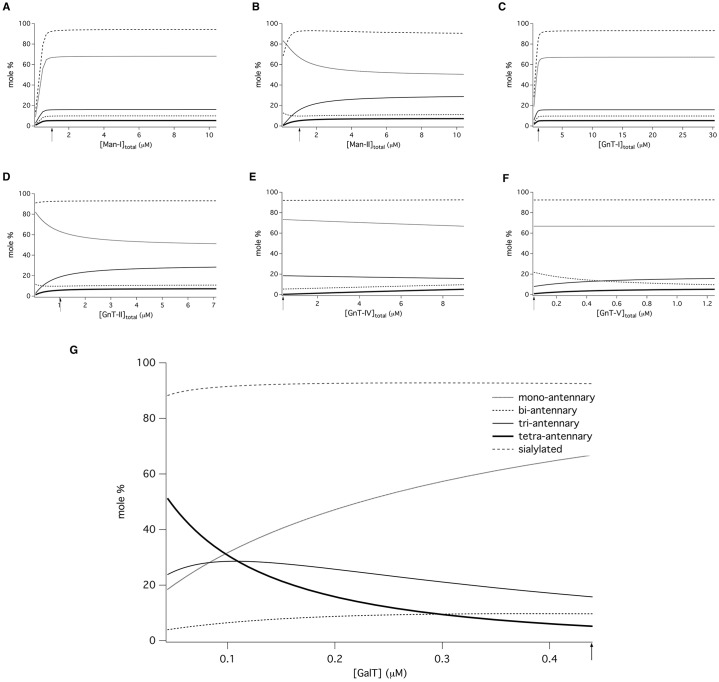
Fig. 2.
Computational model predicts galactosyltransferase controls glycan antennarity. In silico variation of local enzyme concentrations: (A) ManI; (B) ManII; (C) GnTI; (D) GnTII; (E) GnTIV; (F) GnTV; (G) GalT. Final concentrations of N-glycan structures of different antennarities predicted by the kinetic model are plotted as a function of the total concentration of GalT, when combined with a 25-fold overexpression of GnTIV and GnTV. The position of the arrow on each abscissa indicates the default enzyme concentration. Values on each ordinate axis are expressed as a molar percentage of the total concentration of all N-glycan forms.

