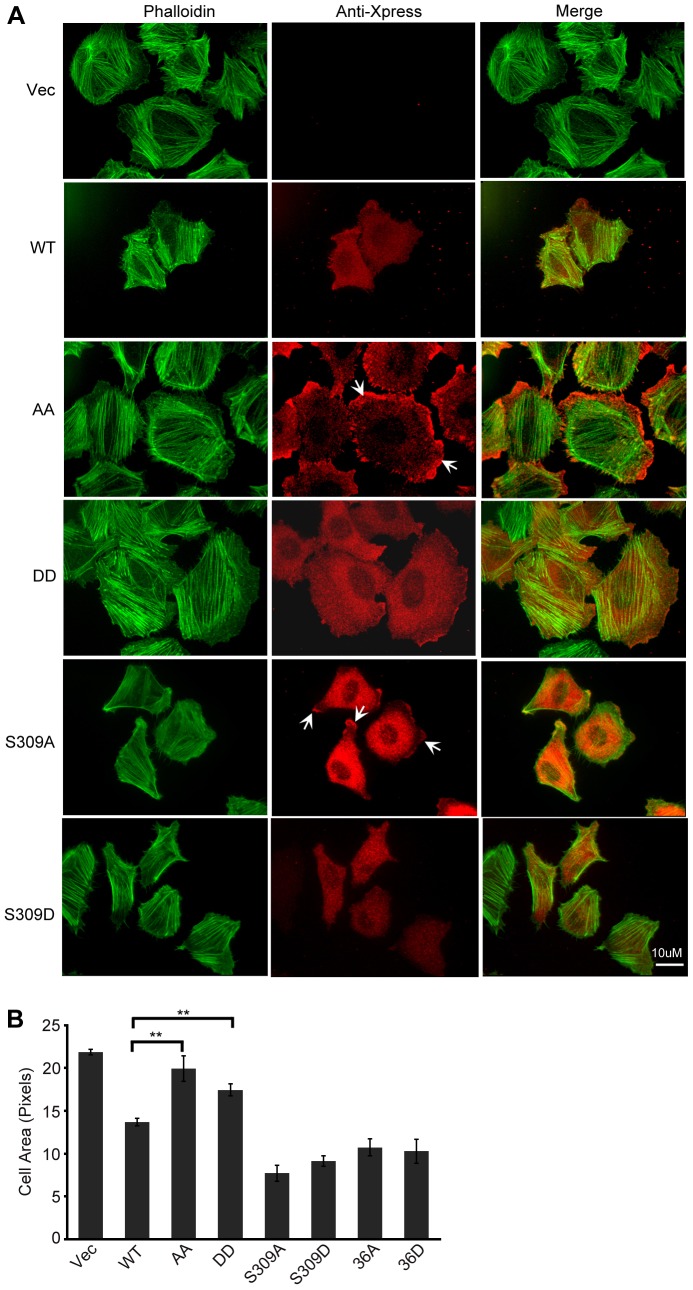
Fig. 5.
Effects of single and double mutations of CAP1 phosphorylaton sites on the subcellular localization of CAP1 and the rescue of the enlarged-cell-size phenotype in the CAP1-knockdown HeLa cells. (A) Confocal images showing cells re-expressing a CAP1 mutant (S309A, S309D, AA, DD, S36A or S36D) or WTCAP1. Cells were fixed with 3.7% formaldehyde and stained with mouse anti-Xpress followed by Alexa-Flour 594 for CAP1 and Alexa-Flour-488-conjugated phalloidin for F-actin. The arrows indicate peripheral localization of CAP1 mutants (AA and S309A). (B) Quantification of cell area (measured with ImageJ software) carried out similarly as done for that shown in Fig. 1C. Results from three independent experiments were analyzed using Student's t-test and plotted in the graph where the error bars represent ±s.e.m; **P<0.01.

