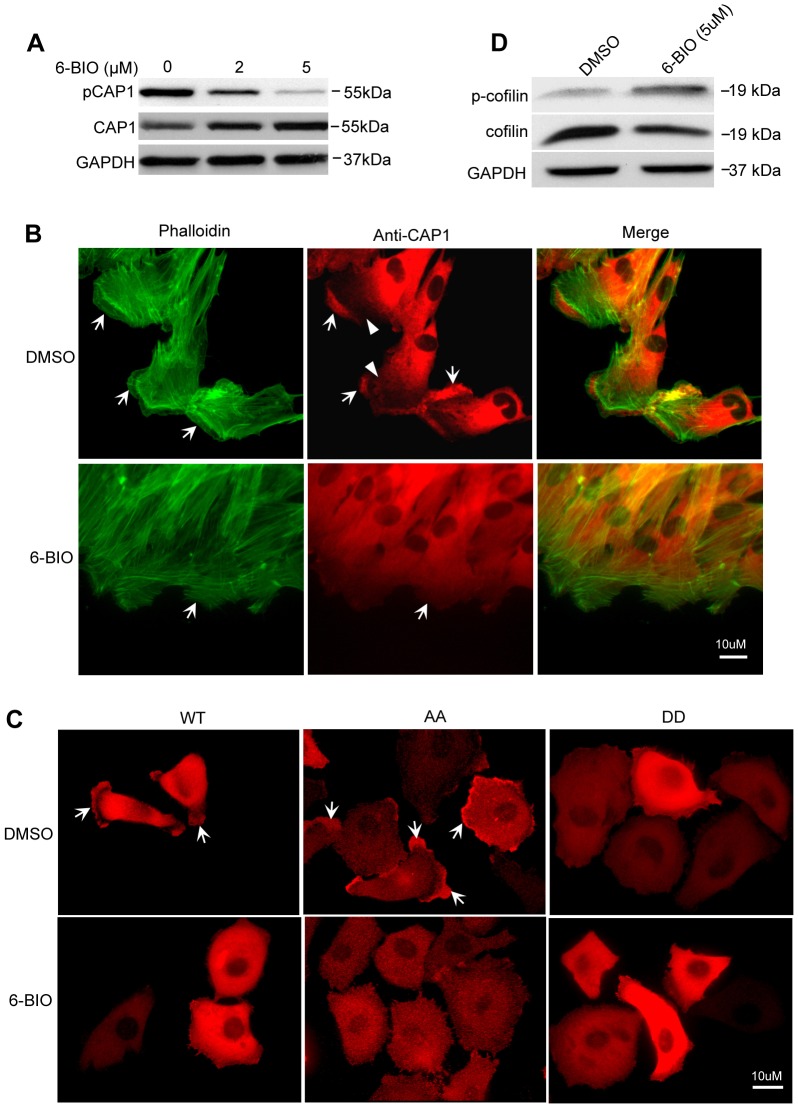
Fig. 6.
Effects of GSK3 inhibition on the actin cytoskeleton and CAP1 localization. (A) Treatment with 6-BIO reduced S307/S309 phosphorylation of CAP1 in hTERT-HPNE cells. (B) GSK3 suppression caused accumulation of stress fibers, reduced cell polarity and loss of CAP1 enrichment at the leading edge of the cell. Control cells (top panels) had well-established cell polarity and leading edges (indicated by arrows), cells treated with 6-BIO for 5 hrs lost this polarity (bottom panels; cells indicated by arrows). Cells were stained with CAP1 antibody and visualized with an Alex-Fluor 594 goat anti-mouse secondary antibody in addition to phalliodin conjugated to Alexa-Fluor 488. CAP1 is enriched at the leading edge of the control cells, whereas the cytosolic areas immediately behind the leading edges had very weak CAP1 staining (indicated by arrowheads). In contrast, CAP1 had a diffuse localization across the cytosol in cells treated with 6-BIO, including the area mentioned above. (C) GSK3 suppression caused relocalization of both WTCAP1 and the AA mutant. CAP1 knockdown HeLa cells that re-express WTCAP1, and AA or DD mutants were treated with 6-BIO, and tagged CAP1 was stained with an X-press antibody followed by visualization using an Alexa-Fluor 594 goat anti-mouse secondary antibody. The arrows indicate peripheral localization of WTCAP1 and the AA mutant, and both of which were abolished by suppression of GSK3. (D) GSK3 inhibition led to reduced cofilin activity, including downregulation of cofilin as well as elevated cofilin phosphorylation at S3. HeLa cells were treated with 5 µM 6-BIO for 5 hrs, and cofilin and S3-phosphorylated cofilin were detected in western blotting.

