
Fig. 3.
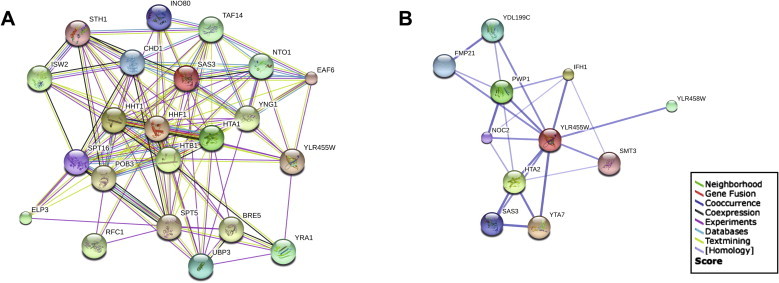
A novel network of Pdp3 interactions identified by TAP–MS. (A) Schematic representation of the interaction network generated from the evidence view of the STRING interactions. The different coloured lines represent the types of experimental evidence available for each of the interacting partners shown. (B) The Pdp3p (YLR455W/PDP3 gene) interaction network previously published on BIOGRID (string-db.org). (For interpretation of the references to colour in this figure legend, the reader is referred to the web version of this article.)