
Fig. 5.
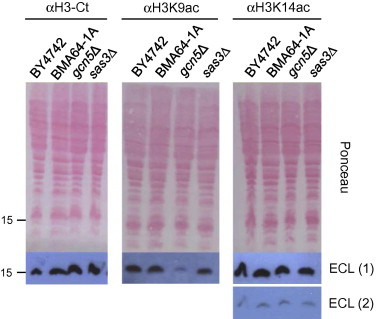
Acetylation levels of histone H3 at lysines 9 and 14 in vivo. The indicated strains were cultured to exponential growth (OD600 ≈ 0.8), alkaline-lysed and pelleted. Proteins contained in the crude extracts (0.3 OD600 units) were resolved by SDS–PAGE (16%) and transferred to nitrocellulose membranes. The amounts of total and modified histones were determined by immunodetection with the antibodies indicated in the figure; different exposure times (ECL 2 vs. ECL 1) demonstrate that the chemiluminescence signal was not saturated. The Ponceau S staining of the membrane is shown as a loading control. The position of the 15 kDa molecular mass marker is indicated on the left.