
Fig. 6.
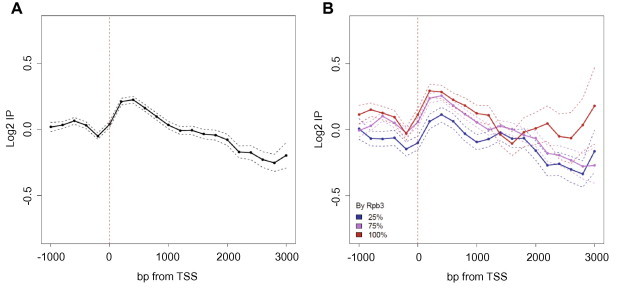
Genome-wide profile of Sas3p location. The Sas3-HA tagged protein was immunoprecipitated with an anti-HA 3F10 antibody. The log2 values of the specific immunoprecipitation of the tagged strain are represented in relation to the immunoprecipitation of a non-tagged strain. For the real-length representation, profiles were centred on the actual transcription start site (TSS) [46] and the data for each probe corresponded to their real distance from the TSS for each gene, from 1000 bp upstream to the total transcript length, to a maximum of 3000 bp downstream. Probes were binned to 200 bp. The mean and confidence intervals for the means (t-test, 95% confidence) were plotted (A). The real-length representation of the profile of the Sas3p location of the genes grouped according to the distribution of RNAPII [47] on the gene (B). The figures show the average of two independent biological experiments.