
Fig. 7.
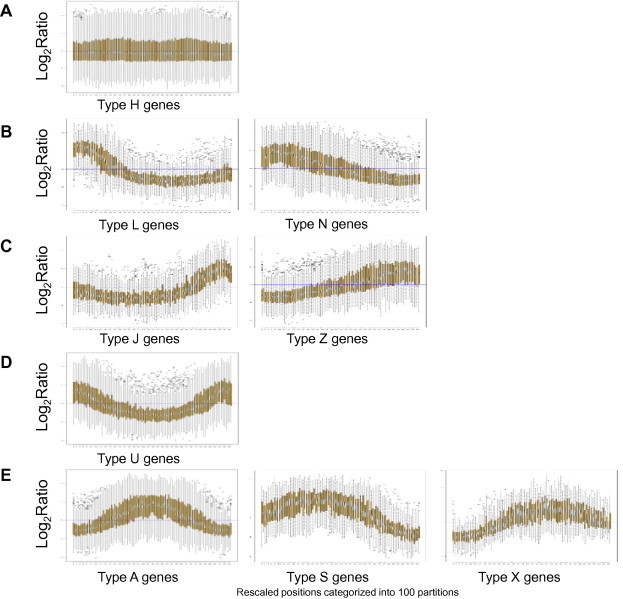
Boxplot representation of the Sas3p binding to different groups of genes. (A) Boxplot of an average type H gene (2644 genes). The chromosomal positions for each gene were categorised into 100 partitions. Log2 ratio values were extracted for the corresponding probes for all these partitions. (B) Boxplot of an average gene of cluster 1 (936 genes, type L or N). Data are represented as in (A). (C) Boxplot of an average gene of cluster 2 (706 genes, type J or Z). Data are represented as in A. (D) Boxplot of an average gene of cluster 3 (405 genes, type U). Data are represented as in A. (E) Boxplot of an average gene of cluster 4 (759 genes, type A, S or X). Data are represented as in A.