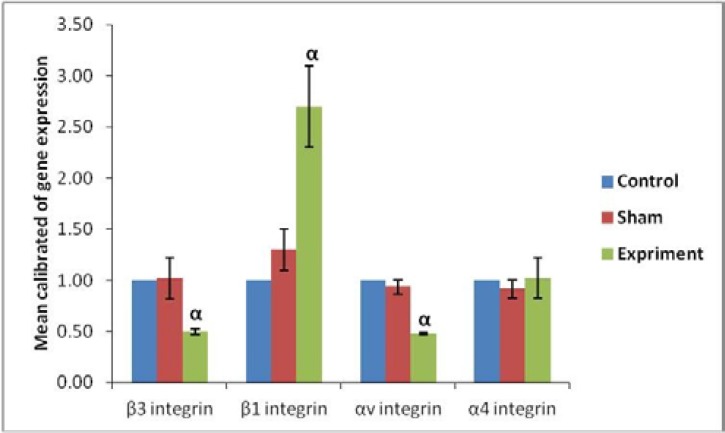
Figure 3.
Real Time-PCR analysis. mRNA levels were normalized with respect to β-actin, chosen as an internal control and calibrated to control group. Profile of Integrin genes' expression on the blastocyst surface after using a single intramuscular dose of estradiol valerate, 40 mg/kg. Histograms show mean expression values (±SD; p<0.05). α: significant difference with other groups in the same genes.

