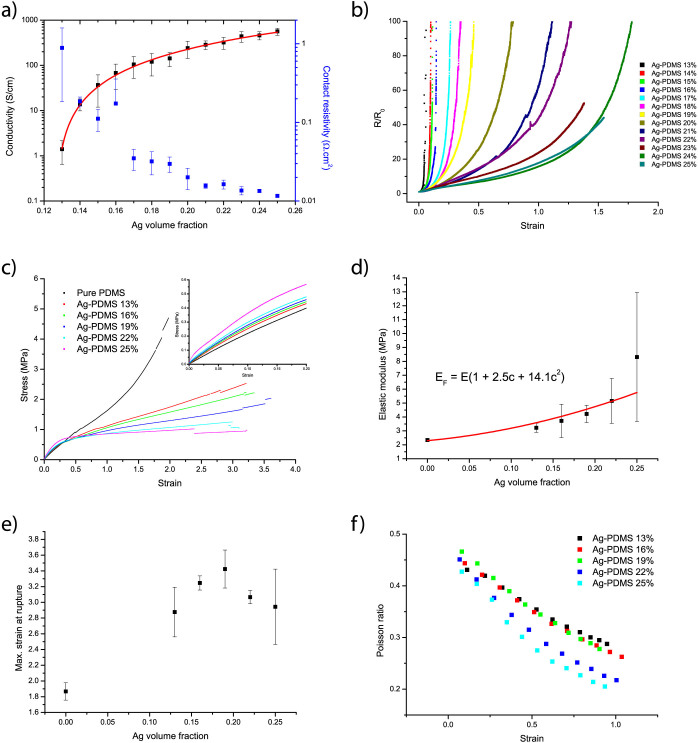
Figure 2. Electro-mechanical properties of different Ag-PDMS composites.
(a) Electrical conductivity and contact resistivity of Ag-PDMS composite as a function of silver volume fraction (n = 3). Fitted parameters of the percolation model (red line) are σ0 = 18168 S/cm, ct = 12.6% and t = 1.68; adj. R-squared is 99.2%. (b) Changes in resistance during quasi-static stretching tests. (c) Stress-strain curves at low strain rate for pure PDMS (black), Ag-PDMS 13vol% (red), 16vol% (green), 19vol% (dark blue), 22vol% (light blue) and 25vol% (pink) (n = 3, error bars removed for clarity). Elastic moduli were derived from the slope at 1% strain (inset) and (d) plotted vs silver volume content. Data are well fitted with the Guth-Smallwood equation. E is the elastic modulus of pure PDMS and c is the silver volume fraction. (e) Maximal strain at rupture as a function of filler content (n = 3) and (f) measured Poisson ratios for different silver contents.

