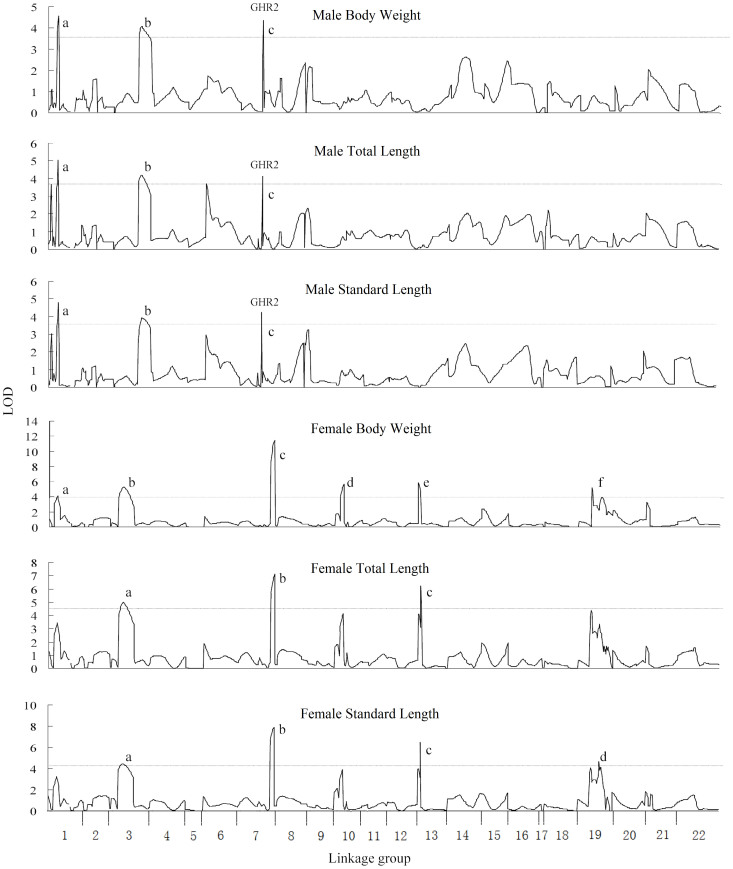
Figure 2. QTL for growth traits mapped on the tilapia genome in male and female subpopulations.
The QTL surpassed the significant LOD threshold (P < 0.05) are genome-wide significant. The length of each linkage group is proportional to the genetic length (cM). The lower case letters indicate the identified QTL, which are described in Table 1. The names of traits are presented above their respective figures.

