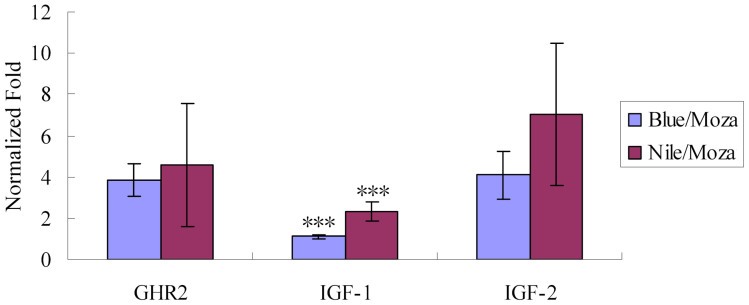
Figure 5. Temporal expressions of GHR2, IGF-1 and IGF-2 in tilapia with two GHR2 genotypes.
“Blue/Moza” represents the tilapia with one blue tilapia GHR2 allele and one Mozambique tilapia GHR2 allele; “Nile/Moza” represents the tilapia with one Nile tilapia GHR2 allele and one Mozambique tilapia GHR2 allele. The expression levels of genes are indicated using fold normalized by internal control. “***” indicates P < 0.001.

