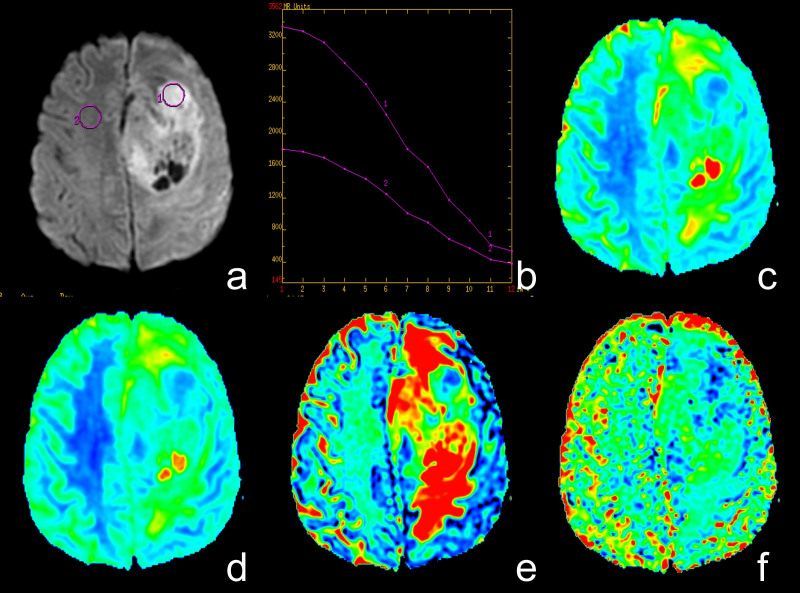
Figure 5. A case of high-grade glioma.
(a) Axial diffusion-weighted trace image (b = 1000 sec/mm2). (b) The bi-exponential fitting of the diffusion signal decay over a wide-range of b values (up to 3,500). (c) Axial apparent diffusion coefficient (ADC) map. (d) The D map. (e) The f map. (f) The D* map. The DWI shows inhomogeneous signal intensity mass on the left frontal-parietal lobe in a patient with grade IV glioma, with significantly high signal intensity (ROI 1) in tumor. On the ADC and D map, the area of restricted diffusion is confirmed as an isointense lesion (decreased ADC value, encoded in a blue color) compared to the healthy white matter (ROI 2). The f map demonstrates a higher perfusion fraction region compared to the healthy white matter. The D* map shows a slightly decreased fast-diffusion values in the tumor tissue compared to the healthy white matter.

