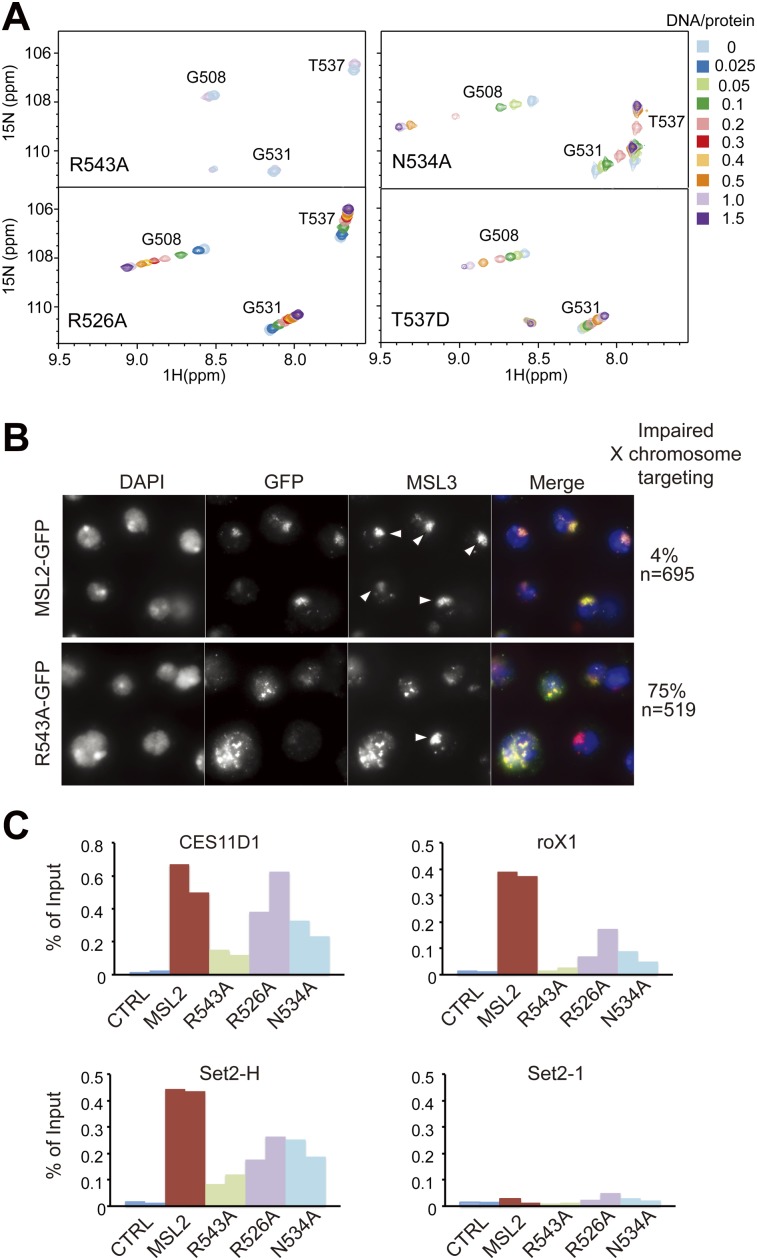
Figure 4.
Mutational analysis of the CXC domain. (A) Titration of CXC mutants with S12 DNA. Selected regions of HSQC spectra are shown. (B) Immunofluorescence analysis of the X chromosomal territories in S2 cell lines stably expressing MSL2-GFP or its R543A mutant using antibodies against GFP and MSL3. Arrowheads indicate compact normal X territories. Unmarked GFP-expressing cells lack a distinct chromosomal territory and show delocalized MSL2-GFP and endogenous MSL3. The percentage of cells that show such defects is displayed at the right. (C) ChIP assays on S2 cells (CTRL) or stable cell lines expressing MSL2-GFP or its mutants (R543A, R526A, and N534A). The binding of MSL2 or one of the mutants to three high-affinity sites (CES11D1, roX1, and Set2-H) or to a control locus that has no MRE sequences (Set2-1) from two independent biological replicates is shown side by side and expressed as percentage of input.

