Figure 5.
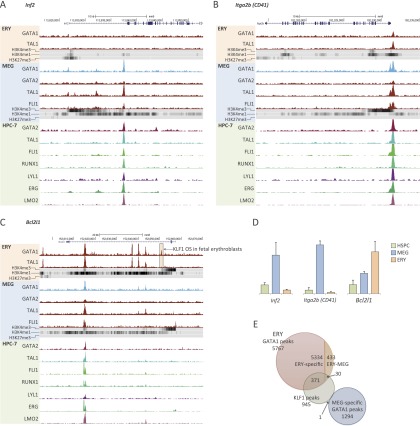
Developmentally regulated loci in erythro-megakaryopoiesis. (A–C) Selected genes are shown with the direction of transcription indicated by arrows and exons represented by black rectangles. ChIP-seq data showing transcription factor occupancy and histone marks in ERY, MEG, and HPC-7 cells are indicated below (Wilson et al. 2010). A GATA1 OS (boxed) in the Bcl2l1 gene (C) overlaps with a KLF1 OS identified previously in murine fetal liver erythroblasts (Tallack et al. 2010). (D) Graphs showing relative expression of Inf2, Itga2b, and Bcl2l1 in HSPCs, MEG, and ERY. (E) Genome-wide intersection of GATA1 OSs from our study with a published genome-wide map of KLF1 OSs in E14.5 mouse fetal liver erythroblasts (Tallack et al. 2010).

