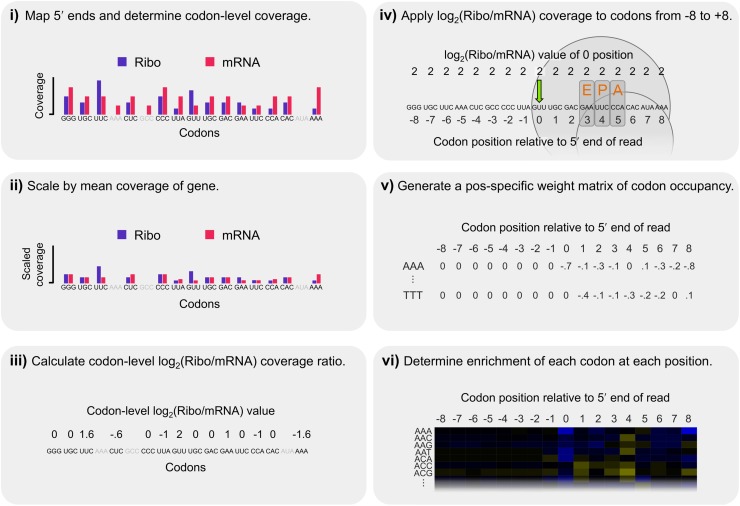
Figure 3.
Steps in our calculation of corrected Ribo coverage. We analyzed Ribo fraction reads in a position-specific manner that controlled for shared biases between the two fractions while making no a priori assumptions about which codon position(s) may be most important in explaining patterns of coverage. (i) The 5′ ends of reads were mapped and codon-level coverage determined from each fraction separately. Only sites with data from both fractions were considered (excluded codons are indicated in gray). (ii) To account for coverage differences among genes, codon-level coverage values were scaled by the mean codon-level coverage of analyzed codons within each gene. (iii) These scaled values were used to calculate a log2(Ribo/mRNA) coverage ratio for each codon, thereby accounting for shared biases between the two fractions. (iv) Because increased coverage at the 5′ position of ribosome-protected fragments could be driven by sequence factors upstream or downstream, the log2(Ribo/mRNA) coverage at position 0 (green arrow) was recorded for all codons from −8 to +8 relative to the 5′ end for each analyzed site. The expected position of the ribosome is indicated for reference. (v) We repeated this across all analyzed codons in the transcriptome, generating a distribution for each of the 61 nonstop codons at each of the 17 positions, representing its position-specific relative contribution to ribosomal occupancy. (vi) Finally, the relative enrichment of each codon at each position was determined by scaling its mean log2(Ribo/mRNA) coverage value by the mean value of all 61 sense codons at that position, such that codons with positive log2 values were enriched relative to expectations and those with negative values were depleted (as plotted as in Fig. 4A).

