
Figure 3.
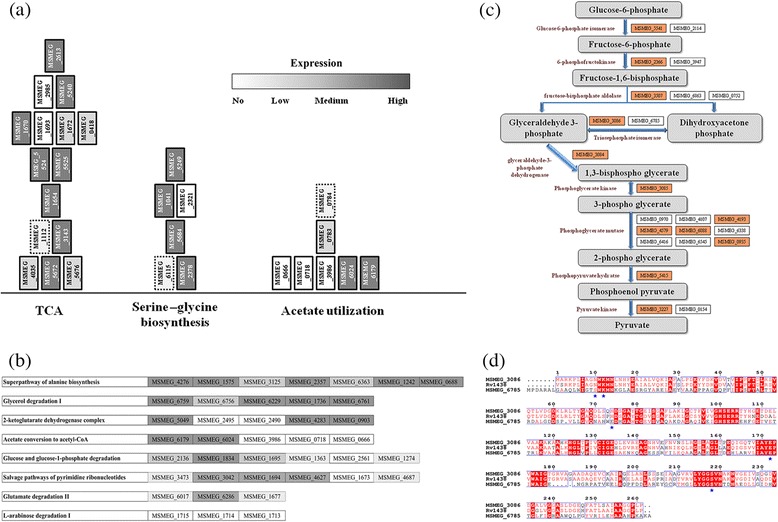
Representation of the feasible pathways identified from transcriptomics and phenotypic analysis. (a) Selected metabolic pathways with enzymes vertically ordered from bottom to top. They are colored in grey scale based on the extent of normalized gene expression. Multiple boxes present in a single layer depict the alternate genes encoding similar enzymes. (b) Representative pathways with the level of gene expression in reference condition (c) Schematic illustrating alternate enzymes being highly expressed in glycolysis, highlighted in orange (d) Multiple sequence alignment of tpi (triose phosphate isomerase) for Mtb and two Msm proteins. Sequence identity and conservation along with catalytic site residues (*) are shown.