Figure 2.

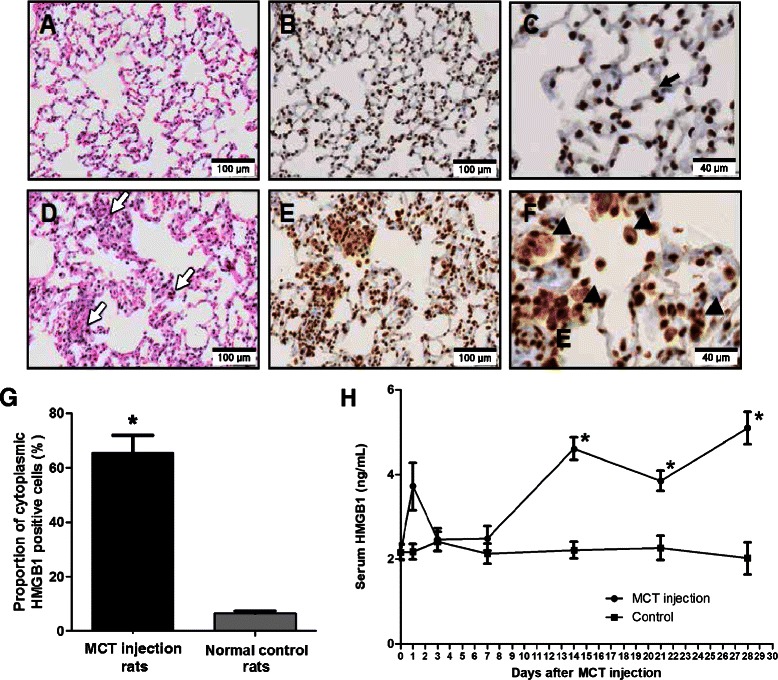
Increased tissue and serum levels of HMGB1 in pulmonary hypertension rats induced by MCT. A–C: Lung sections of normal control rats. D–F: Lung sections of MCT-induced pulmonary hypertension rats at day 28 after MCT injection. A, D: Hematoxylin and eosin staining. B, C, E, F: Immunohistochemical staining with anti-HMGB1 antibody (brown). (A) No inflammatory cell was observed in the lungs of normal control rats. (B, C) HMGB1 was mainly localized to the nucleus (black arrow). (D) A large number of inflammatory cells (white arrow) were recruited to the lungs of MCT-induced pulmonary hypertension rats. (E, F) HMGB1 translocated to the extranuclear area (triangle). (G) The proportion of cytoplasmic HMGB1 positive cells in lung tissue of MCT-induced pulmonary hypertension rats was greater than in that of normal control rats (*p <0.001). (H) Serum levels of HMGB1 in MCT-injected rats increased significantly 2 weeks after the MCT injection and remained elevated (*p <0.001 when compared to initial serum level of HMGB1). Data are presented as means ± SEM (n =10).
