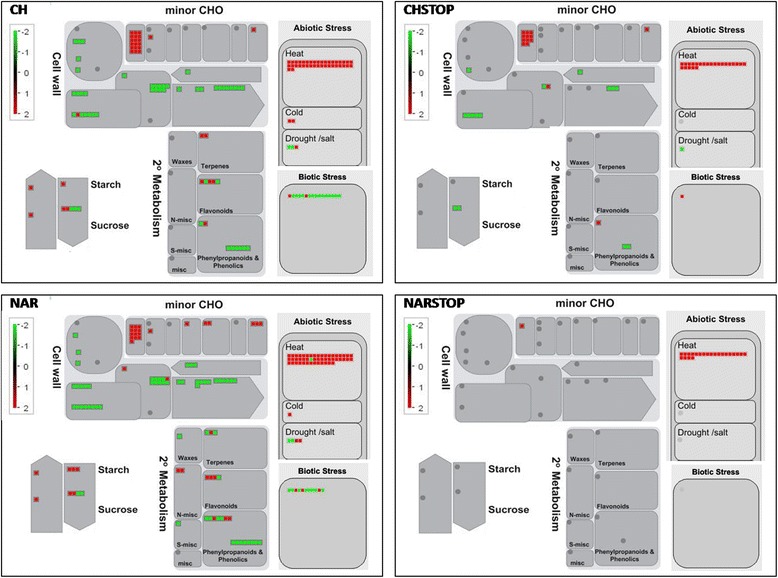
Figure 3.

MapMan analysis. MapMan overview of the metabolism- and cellular response-related genes among the 1,573 genes that were differentially expressed under the four different flavonoid treatments. The presented values are the fold changes between the treatment and control groups. CH – prolonged naringenin-chalcone supp; NAR – prolonged naringenin supp; CHSTOP- short-term naringenin-chalcone supp; NARSTOP – short-term naringenin supp.
