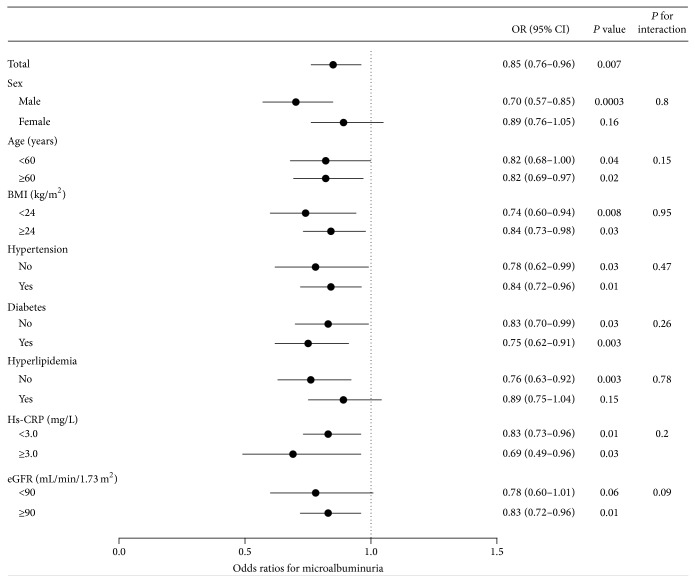
Figure 2.
Adjusted odds ratios (OR) for each 1 s.d. increase in log FT3 concentration associated with the risk of microalbuminuria. Logistic regression model was adjusted for potential confounding factors including age, sex, BMI, smoking and drinking status, SBP and DBP, TC, triglycerides, FPG and OGTT-2 h PG, TPOAb and TgAb, hs-CRP, use of ACEI/ARB drugs, and eGFR (except for the strata variables). CI, confidence interval.

