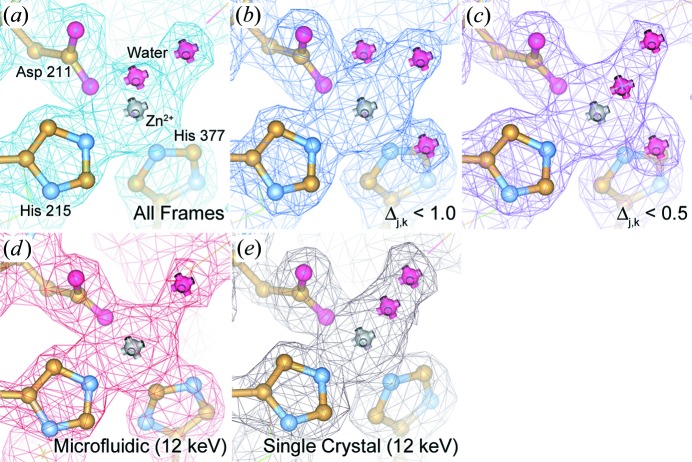
Figure 8.
2F o–F c electron density maps of PhnA. Maps are contoured at 1.5σ and superimposed over a ball-and-stick representation of the protein structure at the active site. Maps are shown for data sets generated both from our serial Laue approach for each of the data subsets (a) all frames, (b) Δj,k < 1.0 and (c) Δj,k < 0.5 as well as monochromatic data collected (d) on chip (10 frames per crystal) and (e) from a single crystal using traditional cryocrystallographic methods (Perry et al., 2013 ▶). The maps for (a) and (e) are processed to a resolution of 2.09 Å, while (b)–(d) are processed to a resolution of 2.11 Å.

