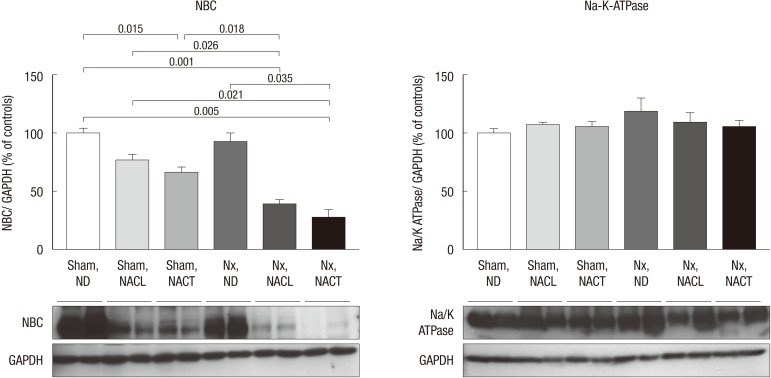
Fig. 4.
Immunoblots of NBC and Na-K-ATPase. In immunoblot analysis, the band density values were standardized by dividing them by the average value of the control group, and the mean for the control group was defined as 100%. Data are presented as the means ± SEM. P values are presented between the groups. SD, standard diet; Nx, nephrectomy; NACL, sodium chloride with 20% casein diet; NACT, sodium citrate (NACT) with 20% casein diet.

