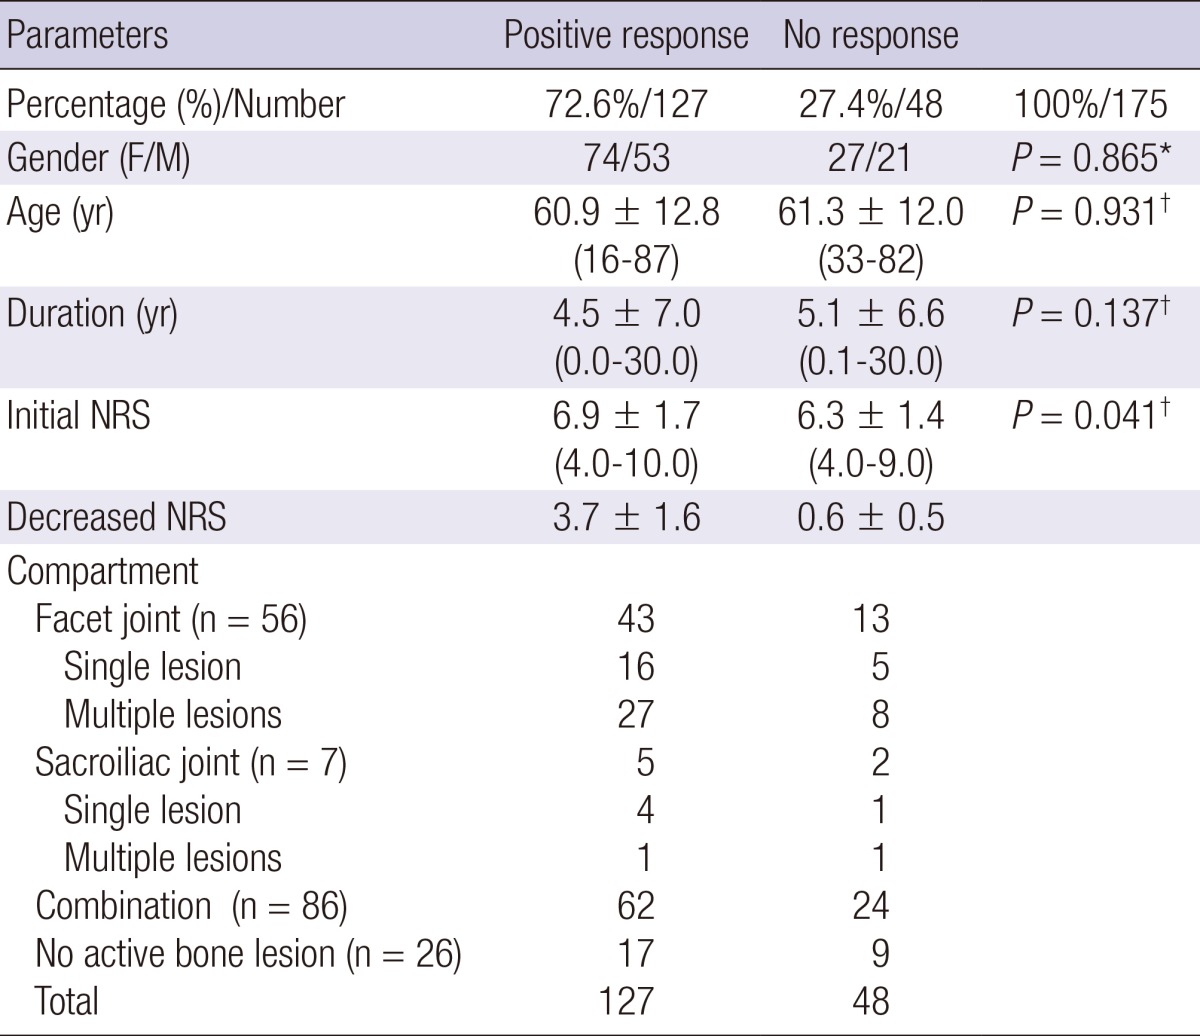
Table 1.
Distribution of patient based on responsiveness to treatment given after bone SPECT/CT imaging

*Fisher's exact test; †Mann-Whitney Test. NRS, numerical rating scale.
Distribution of patient based on responsiveness to treatment given after bone SPECT/CT imaging

*Fisher's exact test; †Mann-Whitney Test. NRS, numerical rating scale.