Figure 5.

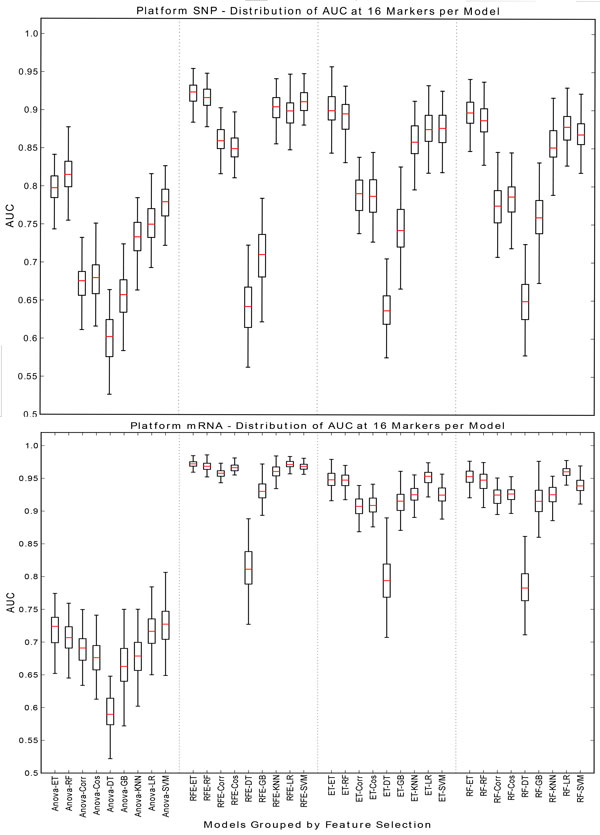
SNP/mRNA: 16 markers. This figure contains box plots describing the AUC of each model, grouped by the feature selection component for SNP and mRNA data type at 16 markers.

SNP/mRNA: 16 markers. This figure contains box plots describing the AUC of each model, grouped by the feature selection component for SNP and mRNA data type at 16 markers.