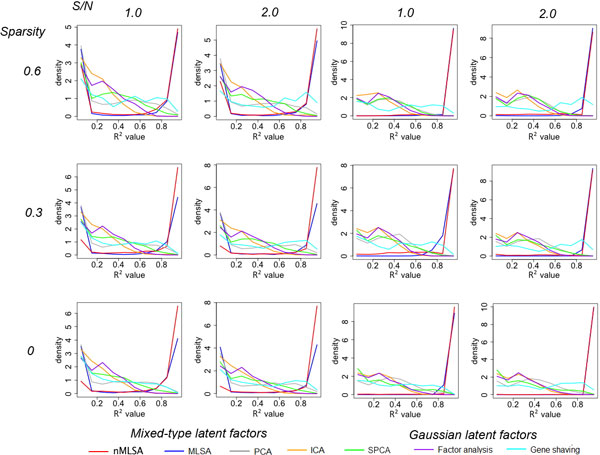
Figure 2.

Simulation results from modular latent structure models. In every simulation, 10 modules, each consisting of 100 simulated genes, were generated. The number of latent factors per module was randomly selected between 1 and 3. The latent factors were either independent Gaussian (two right columns), or randomly chosen from a mixture of four types (two left columns). Gaussian random noise was added to achieve different signal to noise ratios (columns), and different levels of within-module sparsity (proportion of zero loadings) were tested (rows). An additional 1000 pure noise genes were generated from the standard Gaussian distribution. Each simulation setting was repeated 100 times. The success of latent factor recovery was evaluated by the R2 values obtained by the regression of each latent factor against the identified factors assigned to the module to which the latent factor belongs. The relative frequencies (10 equal-sized bins between 0 and 1, equivalent to the histogram) of the R2 values are plotted.
