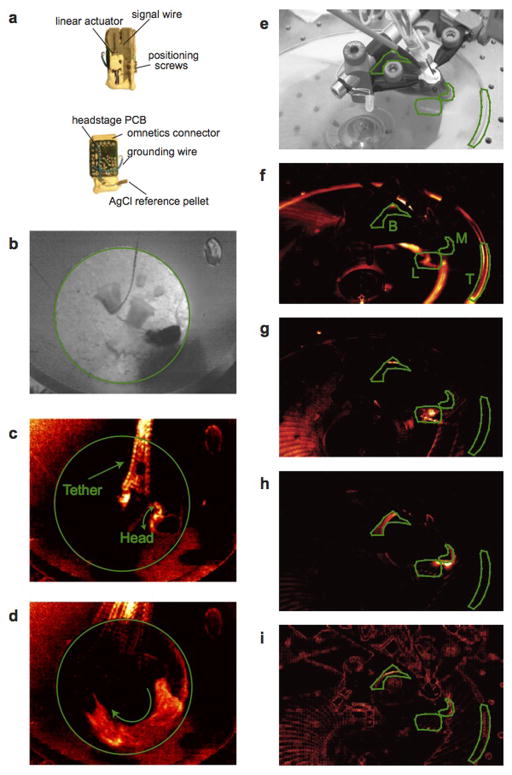
Extended Data Figure 1. Analysis of behavior in unrestrained and head-fixed mice.
a, The miniature-motorized microdrive used for making intracellular recordings from unrestrained mice. b, Video still of unrestrained mouse in a circular arena during microdrive recording. Green circle indicates full-field ROI that was used for semi-automated movement detection. c, Changes in pixel intensity over time were measured to detect movements and the heat map shows the average change in pixel intensity across frames for a 2-second clip. Image in c shows a back-and-forth head movement as indicated by green arrows. d, As in c, but for translocation in the direction indicated by the green arrow. e, Video still of head-restrained mouse positioned on a circular treadmill. Green polygons show regions of interest for the treadmill (T), body (B), forelimb (L) and facial (M), with labels shown in f. f–i, Heat maps showing average movement for 2-second video clips during running (f), forelimb movements (g), grooming (h) and facial movements (i).

