Fig. 3.
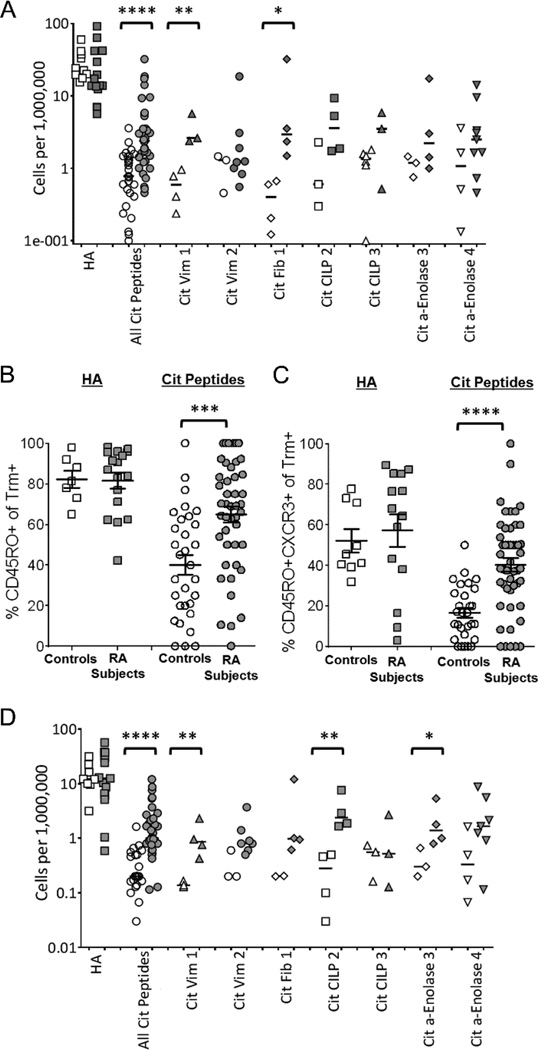
RA patients have an increased number of T cells recognizing citrullinated antigens, and these T cell are skewed towards a TH1 memory response. (A) T cell frequencies were determined directly ex vivo for DR0401-tetramer+CD45RO+ antigen specific T cells. All frequencies are expressed as number of antigen specific cells/million T cells. Comparisons are made between healthy controls (white symbols) and RA patients (gray symbols) for T cells specific for flu (HA306–318), all citrullinated antigens tested, and individual citrullinated peptides tested. Antigen specific T cells were further characterized for their memory phenotype by looking at the percentage of CD45RO+ (B) and CD45RO+CXCR3+ (C) among T cells that were tetramer+. Phenotypic comparisons were made between healthy controls and RA subjects for their flu specific T cells (controls=white boxes, RA=gray boxes) and their citrulline specific T cells (controls = white circles, RA=gray circles). (D) T cell frequencies were determined directly ex vivo for DR0401-tetramer+CD45RO+CXCR3+ antigen specific T cells. Symbols are identical to those used in panel A. Statistical significance was determined by an unpaired T test after normalization for logarithmic distribution (A&D) or by Mann-Whitney test (B&C). *=p<0.05, **=p<0.01, ***=p<0.001, and ****p=<0.0001.

