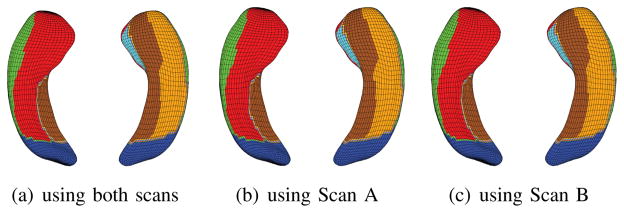
Fig. 8.

Surface atlases of hippocampal subfields created from MRI scans of 26 healthy controls, where each individual was scanned twice. (a) Atlas generated from using both scans, (b) atlas generated from using Scan A only, and (c) atlas generated from using Scan B only. Each of (a–c) visualizes the atlas from two different views. See Fig. 3 for the subfield color map.
