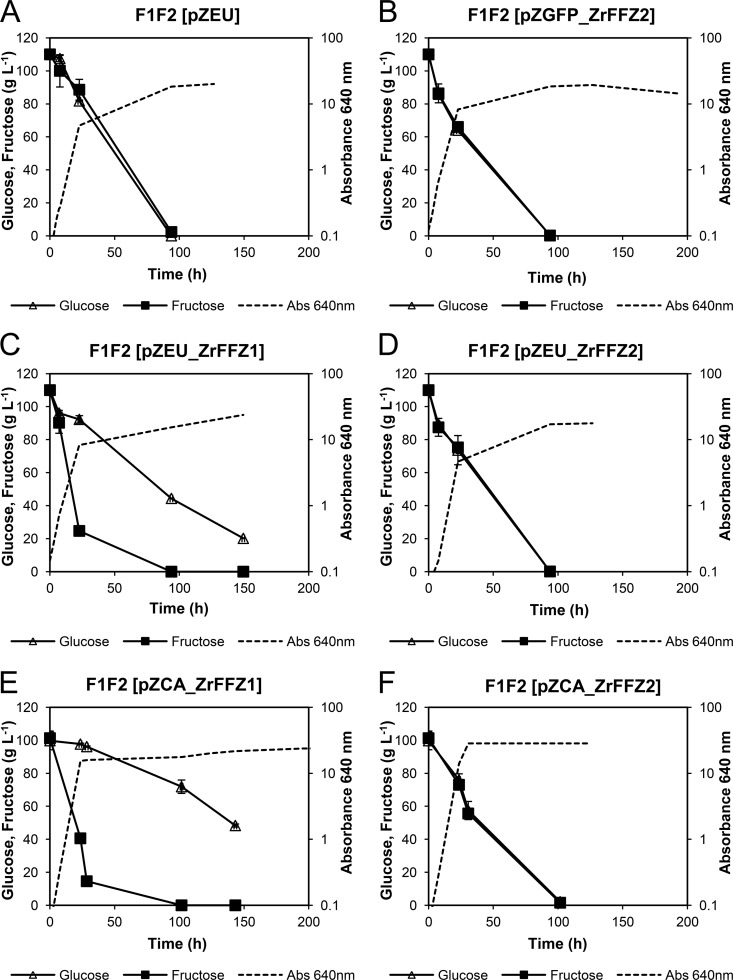
FIG 4.
Fructose and glucose consumption profiles of Z. rouxii strains F1F2(pZEU) (A), F1F2(pZGFP_ZrFFZ2) (B), F1F2(pZEU_ZrFFZ1) (C), F1F2(pZEU_ZrFFZ2) (D), F1F2(pZCA_ZrFFZ1) (E), and F1F2(pZCA_ZrFFZ2) (F) grown in YP plus 100 g liter−1 fructose plus 100 g liter−1 glucose. The data are representative of at least two independent experiments, and the error bars represent SD.

