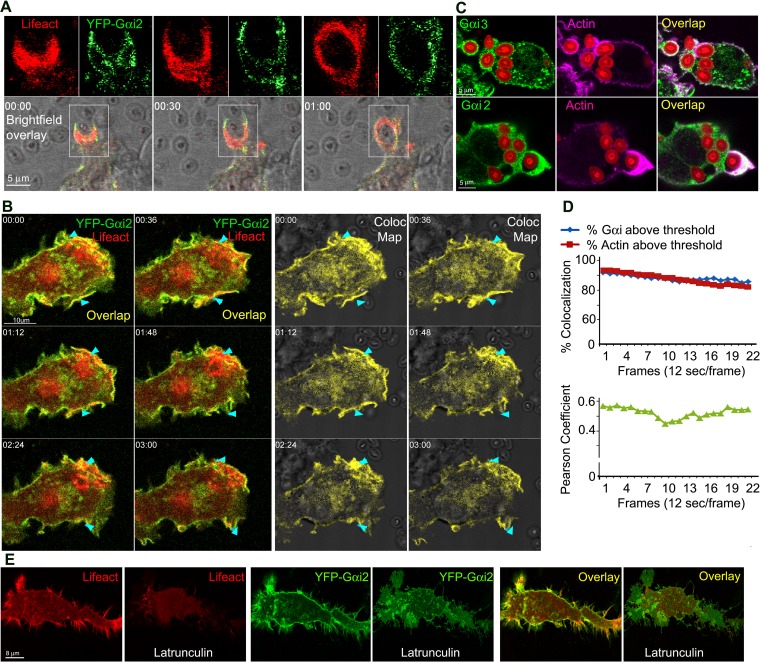
FIG 2.
Gαi proteins colocalize with F-actin at cell protrusions and at phagocytic cups. (A) Time-lapse confocal microscopy of RAW 264.7 cells expressing YFP-Gαi2 (green) and RFP-Lifeact (red) and exposed to zymosan focusing on a phagocytic cup. Numbers represent elapsed time (in minutes). For each time point, a bright-field overlay image and two fluorescent images electronically zoomed 2× are shown. Bar, 5 μm. (B) Time-lapse confocal microscopy images of RAW 264.7 cells expressing YFP-Gαi2 (green) and RFP-Lifeact (red) and exposed to zymosan. Arrowheads indicate Gαi together with actin condensed at membrane protrusions and ruffles targeting and engulfing zymosan. An overlap and corresponding colocalization map is shown. Imaging began 5 min after zymosan addition. Bar, 10 μm. (C) Confocal microscopy of BMDM exposed to fluorescent zymosan and immunostained for Gαi2, Gαi3, and F-actin (phalloidin). Bar, 5 μm. (D) Quantification of YFP-Gαi2 and RFP-Lifeact colocalization over time. The percent colocalization of RFP-Lifeact and YFP-Gαi2 above threshold (above) and Pearson's colocalization coefficient (below) are shown. Images acquired at 12 s/frame. (E) Confocal microscopy of RAW 264.7 cells expressing RFP-Lifeact (red) and YFP-Gαi2 (green) before or after a 15-min exposure to latrunculin B. Individual and overlap images are shown. Bar, 8 μm.

