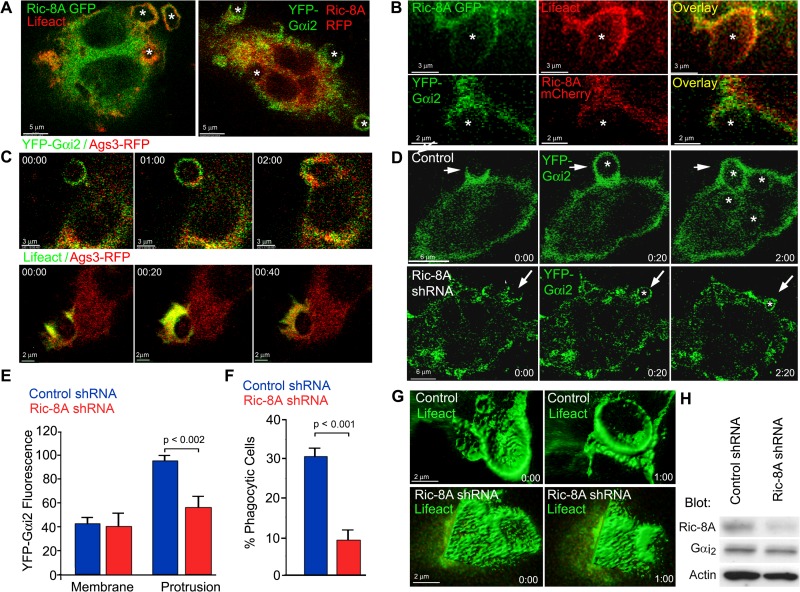
FIG 8.
Ric-8A promotes phagocytosis and phagocytic cup closure. (A) Confocal microscopy of RAW 264.7 cells expressing Ric-8A–GFP and RFP-Lifeact (left) or YFP-Gαi2 and Ric-8A-mCherry (right) following exposure to zymosan. Individual images, fluorescent overlay, and bright-field fluorescent overlay are shown in the region of a phagocytic cup. The locations of zymosan are indicated by asterisks. Bar, 5 μm. (B) Zoomed individual confocal images of RAW 264.7 cell from the image set acquired for panel A. Bars, 3 μm (top), 2 μm (bottom). (C) Time-lapse confocal microscopy of RAW 264.77.4 cells expressing Ags3-RFP and either Gαi2-YFP (top) or GFP-Lifeact (bottom) and exposed to zymosan. Bar, 3 μm (top), 2 μm (bottom). (D) Time-lapse confocal microscopy of RAW 264.7 cells expressing YFP-Gαi2 and either a control shRNA (top) or a Ric-8A shRNA (bottom) and exposed to zymosan. The locations of zymosan are indicated with asterisks. Bars, 6 μm. (E) Recruitment of YFP-Gαi2 to cell protrusions in RAW 264.7 cells expressing either a control shRNA or a Ric-8A shRNA. Fluorescent intensities at the cell membrane and at cell protrusions are shown. Statistics were determined by using the t test. (F) The percentage of RAW 264.7 cells expressing a control or a Ric-8A shRNA that engulfed zymosan over a 15-min period. Statistics were performed using the t test. (G) Time-lapse confocal microscopy of RAW 264.7 cells expressing GFP-Lifeact and either a control (top) or a Ric-8A shRNA (bottom) and exposed to zymosan. The surface rendering of the phagocytic cup was done using Imaris software. Bar, 2 μm. (H) Immunoblot of Ric-8A, Gαi2, and actin levels in cell lysates prepared from control and Ric-8A shRNA-expressing RAW 264.7 cells.

