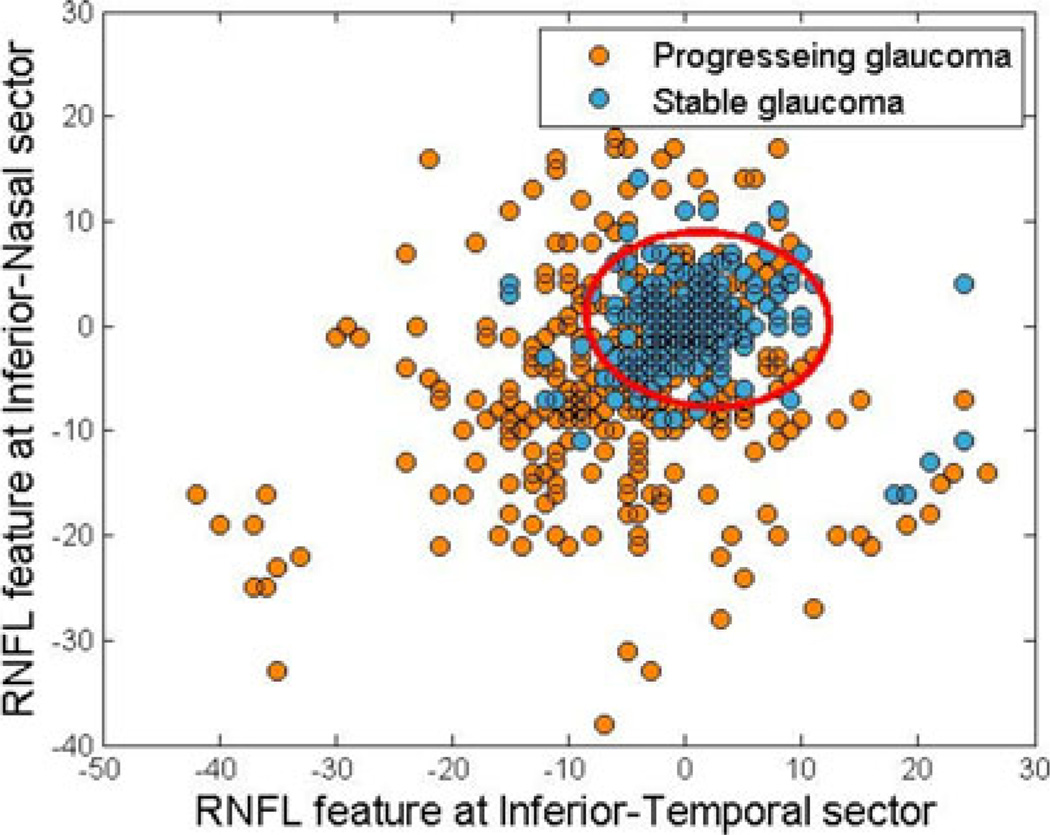
Fig. 6.
Feature distributions and Bayesian discriminating function plotted in 2-D for two best features. Each blue circle represents the RNFL inferior temporal versus inferior nasal feature (difference between RNFL thickness at baseline and follow-up in micron) at a follow-up of an eye that belongs to the stable group, and each orange circle represents RNFL inferior temporal versus inferior nasal feature of an eye that belongs to the progressing group.

