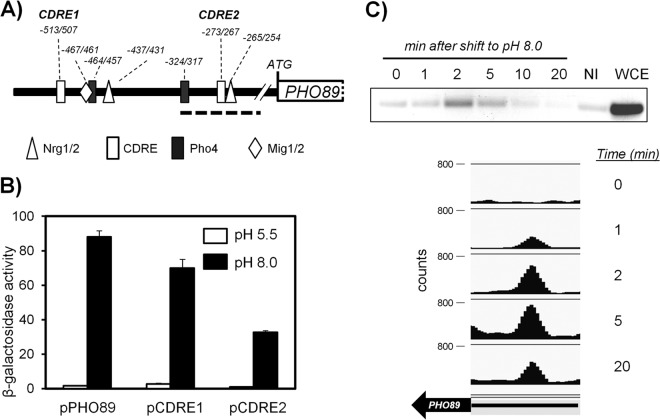
FIG 3.
Functional characterization of two potential CDREs in the PHO89 promoter. (A) Cartoon depicting the predicted regulatory sites in the PHO89 upstream region (see the text for details). The bold discontinuous line spans the region amplified from ChIP samples shown in panel C. (B) Wild-type strain DBY746 was transformed with plasmid pPHO89-LacZ, pPHO89CDRE1-LacZ, or pPHO89CDRE2-LacZ, and cultures were subjected to pH 8.0 or maintained at pH 5.5. β-Galactosidase activity was determined as described in the legend to Fig. 2B. Data are means ± standard errors of the means from 12 determinations. (C, top) Chromatin-immunoprecipitated material from cells exposed to pH 8.0 for the indicated times was subjected to PCR amplification for the 143-nt region encompassing the CDRE2 consensus (discontinuous line in panel A). NI, sample lacking anti-HA antibodies; WCE, whole-cell extract. (Bottom) ChIP samples were subjected to massive sequencing. Mapped reads were quantified, normalized, and represented by using SeqMonk software. The thick arrow represents the PHO89 open reading frame, and the thin line represents the 0.5-kbp upstream region (note that PHO89 is on the Crick strand).

