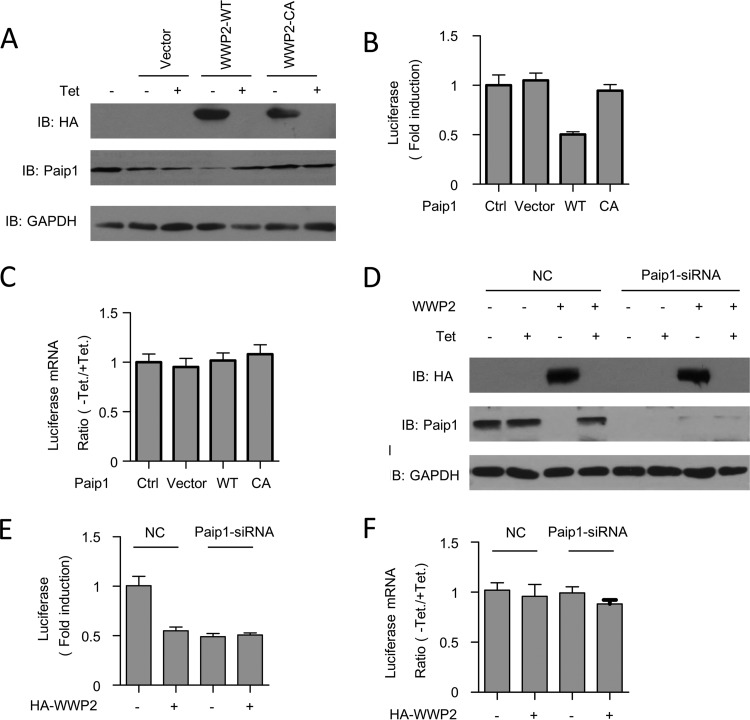
FIG 5.
Overexpression of WWP2 represses translation via the Paip1 protein. (A) Cells were transfected with the indicated pTet-HA-WWP2-WT or catalytic mutant form pTet-HA-WWP2-C838A plasmid, along with constructs expressing Renilla luciferase and tTA. The cells were cultured in medium containing 0 or 300 ng/ml of Tet. Cells were harvested and subjected to Western blot analysis with the indicated antibodies. (B) Renilla luciferase activity was quantified in HeLa cell extracts harvested as described for panel A and normalized on the total protein level. The relative induction of the luciferase reporter was determined by calculating the ratio of Renilla luciferase activity between induced (without Tet) and repressed (with 300 ng/ml Tet) expression of the indicated HA-WWP2. The error bars indicate the standard errors of the mean for the three independent experiments. (C) Quantitative real-time PCR of Renilla luciferase mRNA obtained from total RNA of duplicate HeLa cells harvested as described for panel A. The data are presented as means and SD (n = 3). (D) HeLa cells were transfected with the indicated siRNA sequences. At 24 h after siRNA transfection, the cells were transfected as described for panel A. The cells were subsequently placed in medium containing 0 or 300 ng/ml of Tet. Cells were harvested and subjected to Western blot analysis with the indicated antibodies. (E) Renilla luciferase activity was quantified in HeLa cell extracts harvested as described for panel D and normalized on the total protein level. The relative induction of the luciferase reporter was determined by calculating the ratio of Renilla luciferase activity between induced (without Tet) and repressed (with 300 ng/ml Tet) expression of the indicated HA-WWP2. The error bars indicate the standard errors of the mean for three independent experiments. (F) Quantitative RT-PCR of Renilla luciferase mRNA obtained from the total RNA of the duplicate HeLa cells harvested as described for panel D. The data are presented as means and SD (n = 3).

