FIG 2.
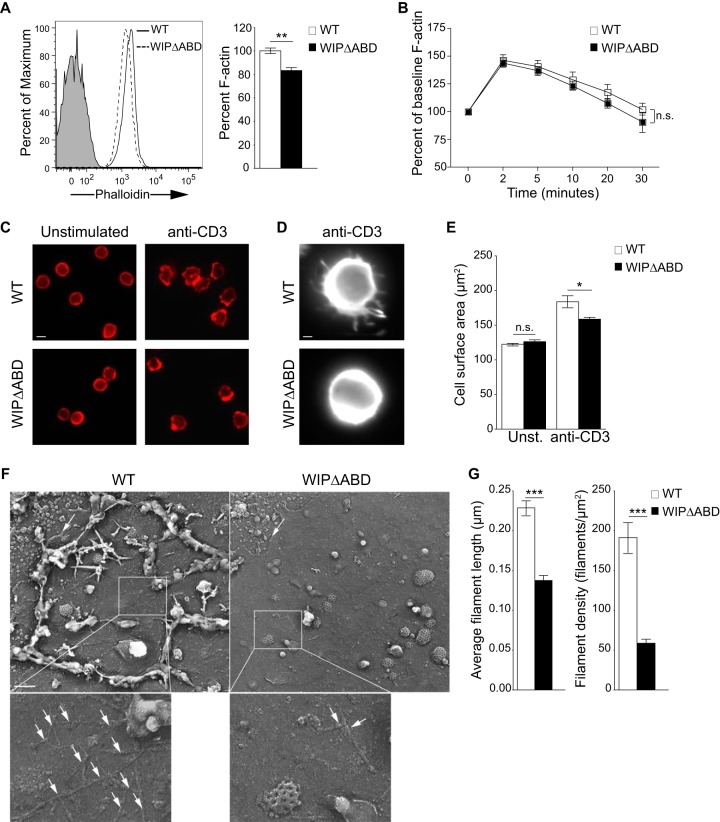
Decreased F-actin content and defective actin cytoskeleton rearrangement and integrity in WIPΔABD T cells. (A) Representative fluorescence-activated cell sorting (FACS) analysis of TRITC-phalloidin staining for F-actin in resting T cells and quantitative analysis of the results as a percentage of the WT controls (n = 3). The solid gray curve in the histogram represents the isotype control. (B) F-actin increase in T cells following stimulation with anti-CD3 MAb. The results are expressed as a percentage of the baseline for each group (n = 3). (C) Intracellular fluorescence of TRITC-phalloidin in T cells stimulated with anti-CD3 MAb (n = 3). Bar, 10 μm. (D) Magnification of one T cell stimulated with anti-CD3 MAb. Bar, 1 μm. (E) Cell surface area of T cells following stimulation with anti-CD3 MAb (n = 3). Unst., unstimulated. A total of 90 cells per condition were counted in each experiment. (F) Representative metal cast electron microscope images of the apical membrane of T cells stimulated with anti-CD3 MAb. Shown are the cytoskeletal actin fibers associated with the cytoplasmic side of the adherent plasma membranes. Clathrin-coated pits can also be seen. The arrows indicate the edge of the cell membrane. Bar, 200 nm. The magnified areas show the actin filaments (arrows) associated with the plasma membranes. (G) Actin filament length and density in T cell membranes from WIPΔABD mice and WT controls visualized in panel F (n = 2 for each group). F-actin was measured in 190 WT T cells and 80 WIPΔABD T cells. Columns or squares and bars represent means ± the SEM. ***, P < 0.0001; **, P < 0.01; *, P < 0.05; n.s., not significant.

