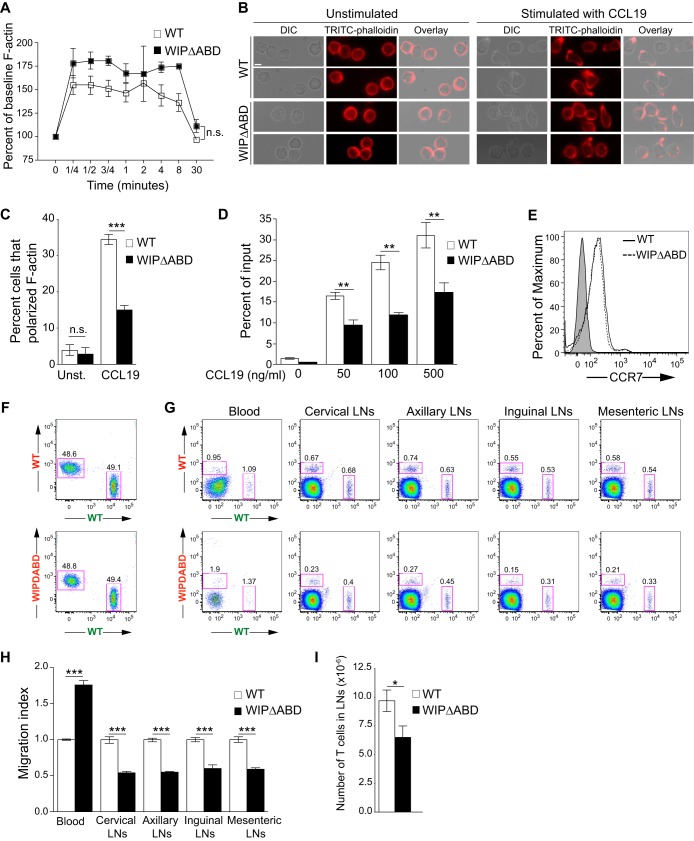
FIG 3.
Defective in vitro migration and in vivo homing of WIPΔABD T cells. (A) F-actin increase in WIPΔABD and WT T cells following stimulation with CCL19. The results are expressed as the percentage of the baseline for each group (n = 3). (B) Differential interference contrast (DIC) images of the cells, TRITC-phalloidin images of F-actin, and an overlay of DIC and TRITC-phalloidin fluorescence images of WIPΔABD and WT T cells show the cellular location of the actin-rich structures at the leading edge and/or in the uropods. Two representative images for each condition are shown. Stimulation with CCL19 resulted in F-actin polarization in three of four (upper panel) and two of two (lower panel) WT T cells shown. In contrast, one of five (upper panel) and one of three (lower panel) WIPΔABD T cells show clear F-actin polarization upon stimulation with CCL19 (n = 3). Bar, 10 μm. (C) Percentages of WIPΔABD and WT T cells that polarize F-actin following stimulation with CCL19 (n = 3). Unst., unstimulated. A total of 180 cells per condition were counted in each experiment. (D) Migration of splenic T cells from WIPΔABD mice and WT controls toward CCL19. The percentage of cells in the lower compartment of a transwell chamber is shown (n = 3 for each group). (E) Representative FACS analysis of CCR7 expression on the surface of splenic T cells purified from WIPΔABD mice and WT controls. Shaded histogram represents the isotype control (n = 3 for each group). (F) Representative FACS analysis of a mixture of equal numbers of Alexa Fluor 488-labeled WT T cells (designated by green lettering) and Alexa Fluor 555-labeled WT or WIPΔABD T cells (designated by red lettering) used for injection into genetically matched WT recipients. (G) Representative FACS analysis of cells from the blood and LNs of WT recipients obtained 1 h after i.v. administration of a 1:1 mixture of equal numbers of Alexa Fluor 488-labeled WT T cells (designated by green lettering) and Alexa Fluor 555-labeled WT or WIPΔABD T cells (designated by red lettering). (H) Quantitative analysis of the homing index of WIPΔABD T cells relative to the mean homing index of WT T cells set at 1.0 (n = 5 for each group). (I) T cell numbers in the inguinal and axillary LNs of WIPΔABD mice and WT controls (n = 6 for each group). Columns and bars represent means ± SEM. ***, P < 0.0001; **, P < 0.01; *, P < 0.05.

